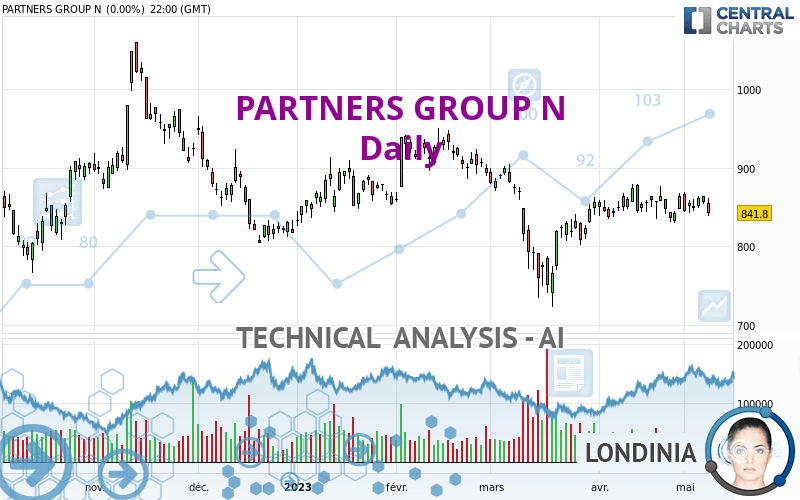
PARTNERS GROUP N - Daily - Technical analysis published on 05/10/2023 (GMT)
- 117
- 0
Click here for a new analysis!
- Timeframe : Daily
- - Analysis generated on
- Status : TARGET REACHED

Summary of the analysis

Additional analysis
Quotes
The PARTNERS GROUP N price is 848.2000 CHF. On the day, this instrument gained +0.76% and was traded between 844.0000 CHF and 849.4000 CHF over the period. The price is currently at +0.50% from its lowest and -0.14% from its highest.The Central Gaps scanner detects a bullish opening marking the presence of buyers ahead of sellers at the opening but not sufficiently marked to allow the price to register a quotation gap.
Bullish opening
Type : Bullish
Timeframe : Openning
Here is a more detailed summary of the historical variations registered by PARTNERS GROUP N:
Near a new HIGH record (1 month)
Type : Bullish
Timeframe : Weekly
Technical
Technical analysis of this Daily chart of PARTNERS GROUP N indicates that the overall trend is strongly bearish. 82.14% of the signals given by moving averages are bearish. The slightly bearish signals from short-term moving averages show that the overall trend is slowing down. The Central Indicators market scanner is currently detecting several bearish and bullish signals that could impact this trend:
Bearish trend reversal : Moving Average 20
Type : Bearish
Timeframe : Daily
Bearish trend reversal : adaptative moving average 20
Type : Bearish
Timeframe : Daily
Bearish trend reversal : adaptative moving average 50
Type : Bearish
Timeframe : Daily
Bullish price crossover with Moving Average 50
Type : Bullish
Timeframe : Daily
The probability of a further decline is low given the direction of the technical indicators.
Central Indicators, the scanner specialised in technical indicators, has identified these signals:
Pivot points : price is under support 1
Type : Neutral
Timeframe : Weekly
Price is back over the pivot point
Type : Bullish
Timeframe : Daily
The Central Patterns scanner, which studies chart patterns, resistances and supports, has identified this signal:
Near support of triangle
Type : Bullish
Timeframe : Daily
Central Candlesticks, the scanner specialised in Japanese candlesticks, detects these bullish signals that could support the hypothesis of a small rebound in the very short term:
Bullish harami
Type : Bullish
Timeframe : Daily
Bullish harami cross
Type : Bullish
Timeframe : Daily
| S3 | S2 | S1 | Price | R1 | R2 | R3 | |
|---|---|---|---|---|---|---|---|
| ProTrendLines | 780.7330 | 804.2000 | 835.9200 | 848.2000 | 874.2000 | 940.0000 | 971.2670 |
| Change (%) | -7.95% | -5.19% | -1.45% | - | +3.07% | +10.82% | +14.51% |
| Change | -67.4670 | -44.0000 | -12.2800 | - | +26.0000 | +91.8000 | +123.0670 |
| Level | Major | Intermediate | Intermediate | - | Minor | Intermediate | Minor |
Attention could also be paid to pivot points to set price objectives:
| Pivot points | S3 | S2 | S1 | PP | R1 | R2 | R3 |
|---|---|---|---|---|---|---|---|
| Standard | 810.8000 | 824.6000 | 833.2000 | 847.0000 | 855.6000 | 869.4000 | 878.0000 |
| Camarilla | 835.6400 | 837.6933 | 839.7467 | 841.8000 | 843.8533 | 845.9067 | 847.9600 |
| Woodie | 808.2000 | 823.3000 | 830.6000 | 845.7000 | 853.0000 | 868.1000 | 875.4000 |
| Fibonacci | 824.6000 | 833.1568 | 838.4432 | 847.0000 | 855.5568 | 860.8432 | 869.4000 |
| Pivot points | S3 | S2 | S1 | PP | R1 | R2 | R3 |
|---|---|---|---|---|---|---|---|
| Standard | 818.8000 | 830.2000 | 845.6000 | 857.0000 | 872.4000 | 883.8000 | 899.2000 |
| Camarilla | 853.6300 | 856.0867 | 858.5433 | 861.0000 | 863.4567 | 865.9133 | 868.3700 |
| Woodie | 820.8000 | 831.2000 | 847.6000 | 858.0000 | 874.4000 | 884.8000 | 901.2000 |
| Fibonacci | 830.2000 | 840.4376 | 846.7624 | 857.0000 | 867.2376 | 873.5624 | 883.8000 |
| Pivot points | S3 | S2 | S1 | PP | R1 | R2 | R3 |
|---|---|---|---|---|---|---|---|
| Standard | 785.4000 | 807.2000 | 835.2000 | 857.0000 | 885.0000 | 906.8000 | 934.8000 |
| Camarilla | 849.5050 | 854.0700 | 858.6350 | 863.2000 | 867.7650 | 872.3300 | 876.8950 |
| Woodie | 788.5000 | 808.7500 | 838.3000 | 858.5500 | 888.1000 | 908.3500 | 937.9000 |
| Fibonacci | 807.2000 | 826.2236 | 837.9764 | 857.0000 | 876.0236 | 887.7764 | 906.8000 |
Numerical data
The following is the status of the technical indicators and moving averages at the time of publication of this technical analysis:
| RSI (14): | 49.78 | |
| MACD (12,26,9): | 1.2204 | |
| Directional Movement: | -3.6432 | |
| AROON (14): | -21.4285 | |
| DEMA (21): | 851.1188 | |
| Parabolic SAR (0,02-0,02-0,2): | 863.6000 | |
| Elder Ray (13): | -3.5801 | |
| Super Trend (3,10): | 803.5229 | |
| Zig ZAG (10): | 846.8000 | |
| VORTEX (21): | 0.9695 | |
| Stochastique (14,3,5): | 40.51 | |
| TEMA (21): | 853.8398 | |
| Williams %R (14): | -62.45 | |
| Chande Momentum Oscillator (20): | -9.2000 | |
| Repulse (5,40,3): | -1.5111 | |
| ROCnROLL: | 2 | |
| TRIX (15,9): | 0.0450 | |
| Courbe Coppock: | 1.26 |
| MA7: | 850.5429 | |
| MA20: | 853.0400 | |
| MA50: | 843.3080 | |
| MA100: | 860.2020 | |
| MAexp7: | 849.8597 | |
| MAexp20: | 849.7610 | |
| MAexp50: | 852.3949 | |
| MAexp100: | 863.4044 | |
| Price / MA7: | -0.28% | |
| Price / MA20: | -0.57% | |
| Price / MA50: | +0.58% | |
| Price / MA100: | -1.40% | |
| Price / MAexp7: | -0.20% | |
| Price / MAexp20: | -0.18% | |
| Price / MAexp50: | -0.49% | |
| Price / MAexp100: | -1.76% |
News
Don't forget to follow the news on PARTNERS GROUP N. At the time of publication of this analysis, the latest news was as follows:
- Partners Group reports on 2022 corporate sustainability performance
- Private markets are switching roles with public markets in financing the real economy, setting the stage for fundamental change within the industry, says new research from Partners Group
- Partners Group signs carbon dioxide removal agreement with Climeworks, a leading provider of high-quality carbon dioxide removal via direct air capture (DAC)
- Partners Group reports continued management fee growth; performance fees in line with guidance; dividend up 12% to CHF 37.00 per share
- Partners Group announces amendments to the composition of its Board of Directors and an addition to its Executive Team
About author
Online


Add a comment
Comments
0 comments on the analysis PARTNERS GROUP N - Daily