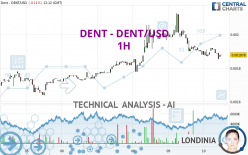
DENT - DENT/USD - 1H - Technical analysis published on 04/10/2024 (GMT)
- 87
- 0
Click here for a new analysis!
- Timeframe : 1H
- - Analysis generated on
- Status : TARGET REACHED

Summary of the analysis
Additional analysis
Quotes
DENT - DENT/USD rating 0.001878 USD. The price registered a decrease of -0.11% on the session and was between 0.001854 USD and 0.001919 USD. This implies that the price is at +1.29% from its lowest and at -2.14% from its highest.So that you have an overall view of the price change, here is a table showing the variations over several periods:
Abnormal volumes
Timeframe : 50 days
Technical
Technical analysis of this 1H chart of DENT - DENT/USD indicates that the overall trend is bearish. The signals given by moving averages are 64.29% bearish. This bearish trend is reinforced by the strong signals currently being given by short-term moving averages. An assessment of moving averages reveals several bearish and bullish signals:
Bearish trend reversal : Moving Average 50
Type : Bearish
Timeframe : 1 hour
Bearish trend reversal : adaptative moving average 100
Type : Bearish
Timeframe : 1 hour
Bullish price crossover with Moving Average 100
Type : Bullish
Timeframe : 1 hour
On the 18 technical indicators analysed, 4 are bullish, 5 are neutral and 9 are bearish. But beware of excesses. The Central Indicators scanner currently detects this:
CCI indicator is oversold : under -100
Type : Neutral
Timeframe : 1 hour
Previous candle closed under Bollinger bands
Type : Neutral
Timeframe : 1 hour
CCI indicator: bullish divergence
Type : Bullish
Timeframe : 1 hour
MACD indicator: bullish divergence
Type : Bullish
Timeframe : 1 hour
RSI indicator: bullish divergence
Type : Bullish
Timeframe : 1 hour
Price is back over the pivot point
Type : Bullish
Timeframe : Weekly
No signals are given by Central Patterns, a market scanner specialised in chart patterns, resistances and supports.
The Central Candlesticks scanner, specialised in Japanese candlesticks, did not identify any signals.
| S3 | S2 | S1 | Price | R1 | R2 | R3 | |
|---|---|---|---|---|---|---|---|
| ProTrendLines | 0.001740 | 0.001778 | 0.001840 | 0.001878 | 0.001900 | 0.001966 | 0.002011 |
| Change (%) | -7.35% | -5.32% | -2.02% | - | +1.17% | +4.69% | +7.08% |
| Change | -0.000138 | -0.000100 | -0.000038 | - | +0.000022 | +0.000088 | +0.000133 |
| Level | Minor | Intermediate | Minor | - | Major | Minor | Intermediate |
Pivot points can also be used to set your price objectives. Here is the price situation in relation to pivot points:
| Pivot points | S3 | S2 | S1 | PP | R1 | R2 | R3 |
|---|---|---|---|---|---|---|---|
| Standard | 0.001551 | 0.001715 | 0.001798 | 0.001962 | 0.002045 | 0.002209 | 0.002292 |
| Camarilla | 0.001812 | 0.001835 | 0.001857 | 0.001880 | 0.001903 | 0.001925 | 0.001948 |
| Woodie | 0.001510 | 0.001695 | 0.001757 | 0.001942 | 0.002004 | 0.002189 | 0.002251 |
| Fibonacci | 0.001715 | 0.001810 | 0.001868 | 0.001962 | 0.002057 | 0.002115 | 0.002209 |
| Pivot points | S3 | S2 | S1 | PP | R1 | R2 | R3 |
|---|---|---|---|---|---|---|---|
| Standard | 0.001284 | 0.001459 | 0.001614 | 0.001789 | 0.001944 | 0.002119 | 0.002274 |
| Camarilla | 0.001679 | 0.001710 | 0.001740 | 0.001770 | 0.001800 | 0.001831 | 0.001861 |
| Woodie | 0.001275 | 0.001454 | 0.001605 | 0.001784 | 0.001935 | 0.002114 | 0.002265 |
| Fibonacci | 0.001459 | 0.001585 | 0.001663 | 0.001789 | 0.001915 | 0.001993 | 0.002119 |
| Pivot points | S3 | S2 | S1 | PP | R1 | R2 | R3 |
|---|---|---|---|---|---|---|---|
| Standard | 0.000104 | 0.000812 | 0.001374 | 0.002082 | 0.002644 | 0.003352 | 0.003914 |
| Camarilla | 0.001588 | 0.001704 | 0.001821 | 0.001937 | 0.002053 | 0.002170 | 0.002286 |
| Woodie | 0.000032 | 0.000776 | 0.001302 | 0.002046 | 0.002572 | 0.003316 | 0.003842 |
| Fibonacci | 0.000812 | 0.001297 | 0.001597 | 0.002082 | 0.002567 | 0.002867 | 0.003352 |
Numerical data
The following is the status of the technical indicators and moving averages at the time of publication of this technical analysis:
| RSI (14): | 42.31 | |
| MACD (12,26,9): | 0.0000 | |
| Directional Movement: | -12.484953 | |
| AROON (14): | -35.714286 | |
| DEMA (21): | 0.001879 | |
| Parabolic SAR (0,02-0,02-0,2): | 0.001900 | |
| Elder Ray (13): | -0.000020 | |
| Super Trend (3,10): | 0.001932 | |
| Zig ZAG (10): | 0.001878 | |
| VORTEX (21): | 0.8143 | |
| Stochastique (14,3,5): | 25.64 | |
| TEMA (21): | 0.001866 | |
| Williams %R (14): | -63.08 | |
| Chande Momentum Oscillator (20): | -0.000002 | |
| Repulse (5,40,3): | -1.4027 | |
| ROCnROLL: | 2 | |
| TRIX (15,9): | -0.1505 | |
| Courbe Coppock: | 2.12 |
| MA7: | 0.001831 | |
| MA20: | 0.001865 | |
| MA50: | 0.001881 | |
| MA100: | 0.001490 | |
| MAexp7: | 0.001883 | |
| MAexp20: | 0.001903 | |
| MAexp50: | 0.001913 | |
| MAexp100: | 0.001885 | |
| Price / MA7: | +2.57% | |
| Price / MA20: | +0.70% | |
| Price / MA50: | -0.16% | |
| Price / MA100: | +26.04% | |
| Price / MAexp7: | -0.27% | |
| Price / MAexp20: | -1.31% | |
| Price / MAexp50: | -1.83% | |
| Price / MAexp100: | -0.37% |
About author

Online


Add a comment
Comments
0 comments on the analysis DENT - DENT/USD - 1H