PEPSICO INC. - Daily - Technical analysis published on 05/18/2022 (GMT)
- 238
- 0
Click here for a new analysis!
- Timeframe : Daily
- - Analysis generated on
- Status : INVALID

Summary of the analysis

Additional analysis
Quotes
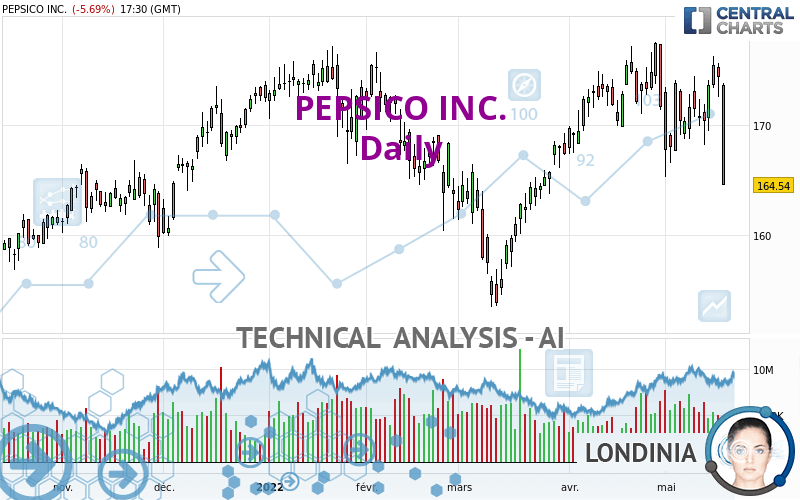
The PEPSICO INC. rating is 164.54 USD. On the day, this instrument lost -5.69% and was traded between 164.54 USD and 173.87 USD over the period. The price is currently at 0% from its lowest and -5.37% from its highest.The Central Gaps scanner detects a bearish opening. A small advantage for sellers in the very short term.
Bearish opening
Type : Bearish
Timeframe : Openning
A study of price movements over other periods shows the following variations:
Near a new HIGH record (5 years)
Type : Bullish
Timeframe : Weekly
Near a new HIGH record (1 year)
Type : Bullish
Timeframe : Weekly
Near a new HIGH record (1st january)
Type : Bullish
Timeframe : Weekly
Near a new HIGH record (1 month)
Type : Bullish
Timeframe : Weekly
Technical
Technical analysis of PEPSICO INC. in Daily shows an overall bearish trend. 67.86% of the signals given by moving averages are bearish. The overall trend is reinforced by the strong bearish signals from short-term moving averages. The Central Indicators market scanner is currently detecting several bearish signals that could impact this trend:
Bearish price crossover with Moving Average 20
Type : Bearish
Timeframe : Daily
Bearish price crossover with Moving Average 50
Type : Bearish
Timeframe : Daily
Bearish price crossover with Moving Average 100
Type : Bearish
Timeframe : Daily
Bearish price crossover with adaptative moving average 20
Type : Bearish
Timeframe : Daily
Bearish price crossover with adaptative moving average 50
Type : Bearish
Timeframe : Daily
Bearish price crossover with adaptative moving average 100
Type : Bearish
Timeframe : Daily
On the 18 technical indicators analysed, 4 are bullish, 5 are neutral and 9 are bearish. Caution: the Central Indicators scanner currently detects an excess:
CCI indicator is oversold : under -100
Type : Neutral
Timeframe : Daily
Williams %R indicator is oversold : under -80
Type : Neutral
Timeframe : Daily
Pivot points : price is under support 3
Type : Neutral
Timeframe : Daily
Pivot points : price is under support 3
Type : Neutral
Timeframe : Weekly
RSI indicator is back under 50
Type : Bearish
Timeframe : Daily
MACD crosses DOWN its Moving Average
Type : Bearish
Timeframe : Daily
Parabolic SAR indicator bearish reversal
Type : Bearish
Timeframe : Daily
Ichimoku - Bearish crossover : Tenkan & Kijun
Type : Bearish
Timeframe : Daily
Momentum indicator is back under 0
Type : Bearish
Timeframe : Daily
Central Patterns, the market scanner focusing on chart patterns, resistances and supports found these results:
Near support of channel
Type : Bullish
Timeframe : Daily
Horizontal support is broken
Type : Bearish
Timeframe : Daily
The Central Candlesticks scanner, specialised in Japanese candlesticks, did not identify any signals.
| S3 | S2 | S1 | Price | R1 | R2 | R3 | |
|---|---|---|---|---|---|---|---|
| ProTrendLines | 143.13 | 148.21 | 153.73 | 164.54 | 167.76 | 174.49 | 177.50 |
| Change (%) | -13.01% | -9.92% | -6.57% | - | +1.96% | +6.05% | +7.88% |
| Change | -21.41 | -16.33 | -10.81 | - | +3.22 | +9.95 | +12.96 |
| Level | Major | Minor | Major | - | Intermediate | Major | Major |
To determine price objectives, it is also possible to use the pivot points. Here is the price position in relation to pivot points:
| Pivot points | S3 | S2 | S1 | PP | R1 | R2 | R3 |
|---|---|---|---|---|---|---|---|
| Standard | 169.70 | 171.14 | 172.80 | 174.24 | 175.90 | 177.34 | 179.00 |
| Camarilla | 173.61 | 173.89 | 174.18 | 174.46 | 174.74 | 175.03 | 175.31 |
| Woodie | 169.81 | 171.20 | 172.91 | 174.30 | 176.01 | 177.40 | 179.11 |
| Fibonacci | 171.14 | 172.32 | 173.06 | 174.24 | 175.42 | 176.16 | 177.34 |
| Pivot points | S3 | S2 | S1 | PP | R1 | R2 | R3 |
|---|---|---|---|---|---|---|---|
| Standard | 163.36 | 165.76 | 169.74 | 172.14 | 176.12 | 178.52 | 182.50 |
| Camarilla | 171.97 | 172.55 | 173.14 | 173.72 | 174.31 | 174.89 | 175.48 |
| Woodie | 164.15 | 166.16 | 170.53 | 172.54 | 176.91 | 178.92 | 183.29 |
| Fibonacci | 165.76 | 168.20 | 169.70 | 172.14 | 174.58 | 176.08 | 178.52 |
| Pivot points | S3 | S2 | S1 | PP | R1 | R2 | R3 |
|---|---|---|---|---|---|---|---|
| Standard | 156.60 | 161.98 | 166.85 | 172.23 | 177.10 | 182.48 | 187.35 |
| Camarilla | 168.89 | 169.83 | 170.77 | 171.71 | 172.65 | 173.59 | 174.53 |
| Woodie | 156.34 | 161.85 | 166.59 | 172.10 | 176.84 | 182.35 | 187.09 |
| Fibonacci | 161.98 | 165.90 | 168.32 | 172.23 | 176.15 | 178.57 | 182.48 |
Numerical data
The following is the status of technical indicators and moving averages registered at the time this technical analysis was created:
| RSI (14): | 39.65 | |
| MACD (12,26,9): | 0.2300 | |
| Directional Movement: | -6.82 | |
| AROON (14): | -100.00 | |
| DEMA (21): | 172.01 | |
| Parabolic SAR (0,02-0,02-0,2): | 176.30 | |
| Elder Ray (13): | -2.09 | |
| Super Trend (3,10): | 178.80 | |
| Zig ZAG (10): | 164.77 | |
| VORTEX (21): | 0.9200 | |
| Stochastique (14,3,5): | 52.78 | |
| TEMA (21): | 171.15 | |
| Williams %R (14): | -98.27 | |
| Chande Momentum Oscillator (20): | -2.81 | |
| Repulse (5,40,3): | -5.9300 | |
| ROCnROLL: | 2 | |
| TRIX (15,9): | 0.0600 | |
| Courbe Coppock: | 1.99 |
| MA7: | 171.58 | |
| MA20: | 172.07 | |
| MA50: | 168.62 | |
| MA100: | 168.98 | |
| MAexp7: | 171.02 | |
| MAexp20: | 171.43 | |
| MAexp50: | 170.03 | |
| MAexp100: | 167.87 | |
| Price / MA7: | -4.10% | |
| Price / MA20: | -4.38% | |
| Price / MA50: | -2.42% | |
| Price / MA100: | -2.63% | |
| Price / MAexp7: | -3.79% | |
| Price / MAexp20: | -4.02% | |
| Price / MAexp50: | -3.23% | |
| Price / MAexp100: | -1.98% |
News
Don't forget to follow the news on PEPSICO INC.. At the time of publication of this analysis, the latest news was as follows:
- PepsiCo, Inc. Announces Pre Stabilisation Notice
- Enjoy Infinite Hydration In Style with New Drinkfinity Bottle
- PepsiCo, Inc Announces Pre Stabilisation Notice
- Families, Invent Away! Frito-Lay Announces Return of "Dreamvention" to Find the Next Best Invention Idea
-
 Tesla Shares Pop After Pepsi Places Order For Electric Semi Trucks | CNBC
About author

Online


Add a comment
Comments
0 comments on the analysis PEPSICO INC. - Daily