PEPSICO INC. - 1H - Technical analysis published on 01/23/2024 (GMT)
- 79
- 0
Click here for a new analysis!
- Timeframe : 1H
- - Analysis generated on
- Status : LEVEL MAINTAINED

Summary of the analysis

Additional analysis
Quotes
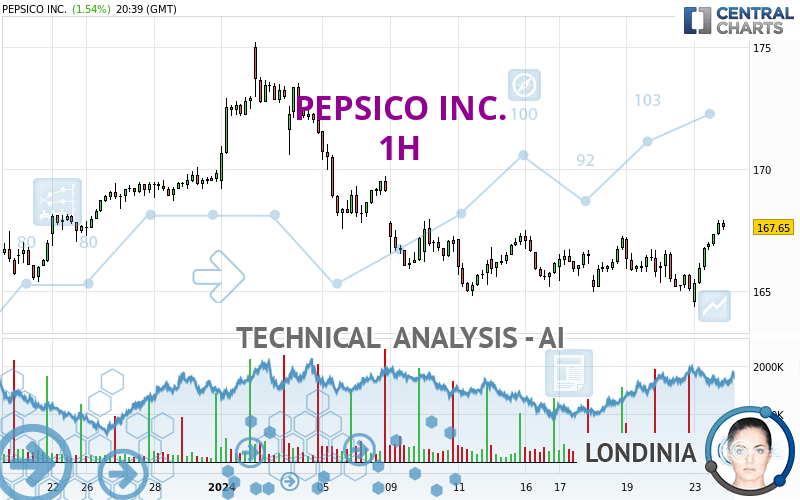
The PEPSICO INC. rating is 167.72 USD. On the day, this instrument gained +1.58% with the lowest point at 164.36 USD and the highest point at 167.93 USD. The deviation from the price is +2.04% for the low point and -0.13% for the high point.A bearish gap was detected at the opening by the Central Gaps scanner. There are a lot of sellers and they have the upper hand in the very short term.
Opening Gap DOWN
Type : Bearish
Timeframe : Openning
So that you have an overall view of the price change, here is a table showing the variations over several periods:
Near a new HIGH record (1st january)
Type : Bullish
Timeframe : Weekly
New LOW record (1st january)
Type : Bearish
Timeframe : Weekly
Near a new HIGH record (1 month)
Type : Bullish
Timeframe : Weekly
New LOW record (1 month)
Type : Bearish
Timeframe : Weekly
Technical
Technical analysis of this 1H chart of PEPSICO INC. indicates that the overall trend is slightly bullish. 60.71% of the signals given by moving averages are bullish. The overall trend could accelerate as strong bullish signals from short-term moving averages are expected. The Central Indicators scanner detects a bearish signal on moving averages that could impact this trend:
Bearish price crossover with Moving Average 100
Type : Bearish
Timeframe : 1 hour
In fact, according to the parameters integrated into the Central Analyzer system, 14 technical indicators out of 18 analysed are currently bullish. But beware of excesses. The Central Indicators scanner currently detects this:
CCI indicator is overbought : over 100
Type : Neutral
Timeframe : 1 hour
Previous candle closed over Bollinger bands
Type : Neutral
Timeframe : 1 hour
Williams %R indicator is overbought : over -20
Type : Neutral
Timeframe : 1 hour
Pivot points : price is over resistance 1
Type : Neutral
Timeframe : Weekly
Pivot points : price is over resistance 2
Type : Neutral
Timeframe : 1 hour
The Central Patterns scanner, which studies chart patterns, resistances and supports, has identified these signals:
Near horizontal resistance
Type : Bearish
Timeframe : 1 hour
Resistance of channel is broken
Type : Bullish
Timeframe : 1 hour
The Central Candlesticks scanner currently notes the presence of this pattern in Japanese candlesticks that could mark the end of the short-term trend currently underway:
Doji
Type : Neutral
Timeframe : 1 hour
| S3 | S2 | S1 | Price | R1 | R2 | R3 | |
|---|---|---|---|---|---|---|---|
| ProTrendLines | 160.96 | 164.39 | 167.28 | 167.72 | 169.25 | 172.05 | 173.04 |
| Change (%) | -4.03% | -1.99% | -0.26% | - | +0.91% | +2.58% | +3.17% |
| Change | -6.76 | -3.33 | -0.44 | - | +1.53 | +4.33 | +5.32 |
| Level | Minor | Major | Intermediate | - | Minor | Intermediate | Intermediate |
Attention could also be paid to pivot points to set price objectives:
| Pivot points | S3 | S2 | S1 | PP | R1 | R2 | R3 |
|---|---|---|---|---|---|---|---|
| Standard | 162.83 | 163.92 | 164.52 | 165.61 | 166.21 | 167.30 | 167.90 |
| Camarilla | 164.65 | 164.80 | 164.96 | 165.11 | 165.27 | 165.42 | 165.58 |
| Woodie | 162.58 | 163.80 | 164.27 | 165.49 | 165.96 | 167.18 | 167.65 |
| Fibonacci | 163.92 | 164.57 | 164.97 | 165.61 | 166.26 | 166.66 | 167.30 |
| Pivot points | S3 | S2 | S1 | PP | R1 | R2 | R3 |
|---|---|---|---|---|---|---|---|
| Standard | 162.14 | 163.57 | 164.67 | 166.10 | 167.20 | 168.63 | 169.73 |
| Camarilla | 165.08 | 165.32 | 165.55 | 165.78 | 166.01 | 166.24 | 166.48 |
| Woodie | 161.99 | 163.49 | 164.52 | 166.02 | 167.05 | 168.55 | 169.58 |
| Fibonacci | 163.57 | 164.53 | 165.13 | 166.10 | 167.06 | 167.66 | 168.63 |
| Pivot points | S3 | S2 | S1 | PP | R1 | R2 | R3 |
|---|---|---|---|---|---|---|---|
| Standard | 159.28 | 162.27 | 166.06 | 169.05 | 172.84 | 175.83 | 179.62 |
| Camarilla | 167.98 | 168.60 | 169.22 | 169.84 | 170.46 | 171.08 | 171.71 |
| Woodie | 159.67 | 162.47 | 166.45 | 169.25 | 173.23 | 176.03 | 180.01 |
| Fibonacci | 162.27 | 164.86 | 166.46 | 169.05 | 171.64 | 173.24 | 175.83 |
Numerical data
The following are the details of the technical indicators and moving averages that were collected to generate this technical analysis:
| RSI (14): | 62.51 | |
| MACD (12,26,9): | 0.2800 | |
| Directional Movement: | 15.50 | |
| AROON (14): | 35.72 | |
| DEMA (21): | 166.69 | |
| Parabolic SAR (0,02-0,02-0,2): | 164.94 | |
| Elder Ray (13): | 1.11 | |
| Super Trend (3,10): | 165.73 | |
| Zig ZAG (10): | 167.65 | |
| VORTEX (21): | 1.0600 | |
| Stochastique (14,3,5): | 95.69 | |
| TEMA (21): | 167.07 | |
| Williams %R (14): | -8.68 | |
| Chande Momentum Oscillator (20): | 1.12 | |
| Repulse (5,40,3): | 0.5000 | |
| ROCnROLL: | 1 | |
| TRIX (15,9): | 0.0000 | |
| Courbe Coppock: | 0.90 |
| MA7: | 166.52 | |
| MA20: | 168.32 | |
| MA50: | 167.68 | |
| MA100: | 167.62 | |
| MAexp7: | 167.01 | |
| MAexp20: | 166.43 | |
| MAexp50: | 166.50 | |
| MAexp100: | 167.08 | |
| Price / MA7: | +0.72% | |
| Price / MA20: | -0.36% | |
| Price / MA50: | +0.02% | |
| Price / MA100: | +0.06% | |
| Price / MAexp7: | +0.43% | |
| Price / MAexp20: | +0.78% | |
| Price / MAexp50: | +0.73% | |
| Price / MAexp100: | +0.38% |
News
Don't forget to follow the news on PEPSICO INC.. At the time of publication of this analysis, the latest news was as follows:
- PepsiCo, Inc. Announces Pre Stabilisation Notice
- Enjoy Infinite Hydration In Style with New Drinkfinity Bottle
- PepsiCo, Inc Announces Pre Stabilisation Notice
- Families, Invent Away! Frito-Lay Announces Return of "Dreamvention" to Find the Next Best Invention Idea
-
 Tesla Shares Pop After Pepsi Places Order For Electric Semi Trucks | CNBC
About author

Online


Add a comment
Comments
0 comments on the analysis PEPSICO INC. - 1H