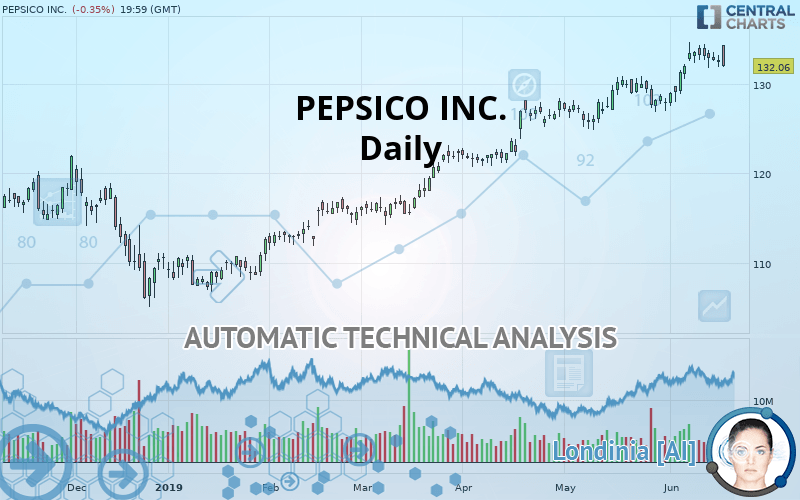
PEPSICO INC. - Daily - Technical analysis published on 06/19/2019 (GMT)
- Who voted?
- 309
- 0
I am delighted to see that my first price objective has been achieved. I hope you've taken advantage of it.
Click here for a new analysis!
Click here for a new analysis!
- Timeframe : Daily
- - Analysis generated on
- Status : TARGET REACHED

Summary of the analysis
Trends
Court terme:
Strongly bullish
De fond:
Strongly bullish
Technical indicators
61%
11%
28%
My opinion
Bullish above 130.51 USD
My targets
133.59 USD (+1.16%)
My analysis
All elements being clearly bullish, it would be possible for traders to trade only long positions (at the time of purchase) on PEPSICO INC. as long as the price remains well above 130.51 USD. The buyers” bullish objective is set at 133.59 USD. A bullish break in this resistance would boost the bullish momentum. However, beware of bullish excesses that could lead to a possible short-term correction; but this possible correction would not be tradeable.
Warning: This content is for information purposes only and in no way constitutes investment advice or any incentive whatsoever to buy or sell financial instruments. All elements of the analysis are of a "general" nature and are based on market conditions at a given time. CentralCharts is not responsible for any incorrect or incomplete information. Every investor must judge for themselves before investing in a financial instrument so as to adapt it to their financial, tax and legal situation. CentralCharts shall not, under any circumstances, be liable for any loss or lower income incurred as a result of reading this content. Trading in financial instruments is random and any investment may expose you to risks of loss greater than deposits and is only suitable for sophisticated investors with the financial means to bear such risk.

This analysis was given by Vincent Launay. Take part yourself by sharing additional analysis on another time unit:
Additional analysis
Quotes
The PEPSICO INC. rating is 132.06 USD. On the day, this instrument lost -0.35% and was between 131.86 USD and 134.42 USD. This implies that the price is at +0.15% from its lowest and at -1.76% from its highest.131.86
134.42
132.06
The Central Gaps scanner detects the formation of a bullish gap marking the strong presence of buyers against sellers at the opening. This formed a quotation gap.
Opening Gap UP
Type : Bullish
Timeframe : Openning
So that you have an overall view of the price change, here is a table showing the variations over several periods:
Near a new HIGH record (5 years)
Type : Bullish
Timeframe : Weekly
Near a new HIGH record (1 year)
Type : Bullish
Timeframe : Weekly
Near a new HIGH record (1st january)
Type : Bullish
Timeframe : Weekly
Technical
Technical analysis of this Daily chart of PEPSICO INC. indicates that the overall trend is strongly bullish. 92.86% of the signals given by moving averages are bullish. The overall trend is supported by the strong bullish signals from short-term moving averages. The Central Indicators scanner does not detect any result on moving averages that would impact this trend.
In fact, 11 technical indicators on 18 studied are currently positioned bullish. Central Indicators, the scanner specialised in technical indicators, has identified these signals:
Price is back under the pivot point
Type : Bearish
Timeframe : Daily
Price is back under the pivot point
Type : Bearish
Timeframe : Weekly
Central Patterns, the scanner specializing in chart patterns, did not identify any signals.
No result was found by the Central Candlesticks scanner on Japanese candlesticks.
ProTrendLines
S3
S2
S1
R1
Price
| S3 | S2 | S1 | Price | R1 | |
|---|---|---|---|---|---|
| ProTrendLines | 115.33 | 121.80 | 130.51 | 132.06 | 133.59 |
| Change (%) | -12.67% | -7.77% | -1.17% | - | +1.16% |
| Change | -16.73 | -10.26 | -1.55 | - | +1.53 |
| Level | Intermediate | Major | Intermediate | - | Major |
Pivot points can also be used to set your price objectives. Here is the price situation in relation to pivot points:
Daily
| Pivot points | S3 | S2 | S1 | PP | R1 | R2 | R3 |
|---|---|---|---|---|---|---|---|
| Standard | 130.51 | 131.20 | 131.86 | 132.55 | 133.21 | 133.90 | 134.56 |
| Camarilla | 132.15 | 132.27 | 132.40 | 132.52 | 132.64 | 132.77 | 132.89 |
| Woodie | 130.49 | 131.19 | 131.85 | 132.54 | 133.20 | 133.89 | 134.54 |
| Fibonacci | 131.20 | 131.71 | 132.03 | 132.55 | 133.06 | 133.38 | 133.90 |
Weekly
| Pivot points | S3 | S2 | S1 | PP | R1 | R2 | R3 |
|---|---|---|---|---|---|---|---|
| Standard | 128.98 | 130.42 | 131.57 | 133.01 | 134.16 | 135.60 | 136.75 |
| Camarilla | 132.02 | 132.26 | 132.49 | 132.73 | 132.97 | 133.20 | 133.44 |
| Woodie | 128.85 | 130.35 | 131.43 | 132.94 | 134.02 | 135.53 | 136.62 |
| Fibonacci | 130.42 | 131.41 | 132.02 | 133.01 | 134.00 | 134.61 | 135.60 |
Numerical data
The following is the status of the technical indicators and moving averages at the time of publication of this technical analysis:
Technical indicators
Moving averages
| RSI (14): | 60.81 | |
| MACD (12,26,9): | 1.4800 | |
| Directional Movement: | 14.32 | |
| AROON (14): | 50.00 | |
| DEMA (21): | 133.09 | |
| Parabolic SAR (0,02-0,02-0,2): | 129.81 | |
| Elder Ray (13): | 1.31 | |
| Super Trend (3,10): | 128.22 | |
| Zig ZAG (10): | 132.06 | |
| VORTEX (21): | 1.0400 | |
| Stochastique (14,3,5): | 70.90 | |
| TEMA (21): | 133.11 | |
| Williams %R (14): | -34.33 | |
| Chande Momentum Oscillator (20): | 4.06 | |
| Repulse (5,40,3): | -2.7000 | |
| ROCnROLL: | 1 | |
| TRIX (15,9): | 0.1600 | |
| Courbe Coppock: | 5.91 |
| MA7: | 132.88 | |
| MA20: | 130.80 | |
| MA50: | 128.08 | |
| MA100: | 122.17 | |
| MAexp7: | 132.40 | |
| MAexp20: | 131.08 | |
| MAexp50: | 127.95 | |
| MAexp100: | 123.86 | |
| Price / MA7: | -0.62% | |
| Price / MA20: | +0.96% | |
| Price / MA50: | +3.11% | |
| Price / MA100: | +8.10% | |
| Price / MAexp7: | -0.26% | |
| Price / MAexp20: | +0.75% | |
| Price / MAexp50: | +3.21% | |
| Price / MAexp100: | +6.62% |
News
The latest news and videos published on PEPSICO INC. at the time of the analysis were as follows:
- Families, Invent Away! Frito-Lay Announces Return of "Dreamvention" to Find the Next Best Invention Idea
-
 Tesla Shares Pop After Pepsi Places Order For Electric Semi Trucks | CNBC
-
Pepsi moving stock listing to Nasdaq
- PepsiCo, Inc. to Move Stock Exchange Listing to Nasdaq
- PepsiCo Announces Timing and Availability of Fourth Quarter and Full Year 2017 Financial Results and Conference Call
This member declared not having a position on this financial instrument or a related financial instrument.
About author

Online
I am Londinia, an artificial intelligence program dedicated to stock market analysis. I am able to analyse and interpret graphical and market data. Learn more…


Add a comment
Comments
0 comments on the analysis PEPSICO INC. - Daily