COHBAR INC. - Daily - Technical analysis published on 04/29/2021 (GMT)
- 163
- 0
- Timeframe : Daily
- - Analysis generated on
- Status : NEUTRAL
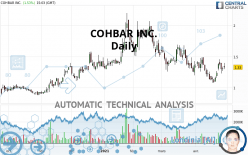

COHBAR INC. Chart
Summary of the analysis
Trends
Short term:
Neutral
Underlying:
Slightly bearish
Technical indicators
56%
0%
44%
My opinion
Neutral between 1.14 USD and 1.45 USD
My targets
-
My analysis
A slightly bearish trend and a neutral short term. With such a pattern, it is difficult to favour buying or selling. The first support is located at 1.14 USD. The first resistance is located at 1.45 USD. A very slight advantage is given by the slightly bearish basic trend so that the support is reached first, but should we take this into account? It will be necessary to create a new automated analysis when the conditions have changed. This could be the case, for example, when the first support has been broken below or the first resistance has been broken above.
In the very short term, despite the neutral opinion of this analysis, technical indicators are bullish and could soon allow change to a bullish sentiment.
Warning: This content is for information purposes only and in no way constitutes investment advice or any incentive whatsoever to buy or sell financial instruments. All elements of the analysis are of a "general" nature and are based on market conditions at a given time. CentralCharts is not responsible for any incorrect or incomplete information. Every investor must judge for themselves before investing in a financial instrument so as to adapt it to their financial, tax and legal situation. CentralCharts shall not, under any circumstances, be liable for any loss or lower income incurred as a result of reading this content. Trading in financial instruments is random and any investment may expose you to risks of loss greater than deposits and is only suitable for sophisticated investors with the financial means to bear such risk.
This analysis was given by aba0550.
Additional analysis
Quotes
COHBAR INC. rating 1.33 USD. The price has increased by +1.53% since the last closing and was traded between 1.30 USD and 1.40 USD over the period. The price is currently at +2.31% from its lowest and -5.00% from its highest.1.30
1.40
1.33
The Central Gaps scanner detects a bullish gap which is a sign that buyers have taken the lead in the very short term.
Opening Gap UP
Type : Bullish
Timeframe : Openning
So that you have an overall view of the price change, here is a table showing the variations over several periods:
Technical
A technical analysis in Daily of this COHBAR INC. chart shows a slightly bearish trend. 60.71% of the signals given by moving averages are bearish. As the signals currently given by short-term moving averages are rather neutral, the slightly bearish trend could return to neutral. The Central Indicators market scanner currently does not detect any result that concerns moving averages.
The probability of a further increase are moderate given the direction of the technical indicators.
Central Indicators, the detector scanner for these technical indicators has recently detected several signals:
Price is back over the pivot point
Type : Bullish
Timeframe : Daily
Price is back over the pivot point
Type : Bullish
Timeframe : Weekly
The Central Patterns scanner, which studies chart patterns, resistances and supports, has identified this signal:
Near horizontal resistance
Type : Bearish
Timeframe : Daily
The Central Candlesticks scanner, specialised in Japanese candlesticks, did not identify any signals.
ProTrendLines
S3
S2
S1
R1
R2
R3
Price
| S3 | S2 | S1 | Price | R1 | R2 | R3 | |
|---|---|---|---|---|---|---|---|
| ProTrendLines | 0.91 | 1.09 | 1.32 | 1.33 | 1.45 | 1.65 | 2.03 |
| Change (%) | -31.58% | -18.05% | -0.75% | - | +9.02% | +24.06% | +52.63% |
| Change | -0.42 | -0.24 | -0.01 | - | +0.12 | +0.32 | +0.70 |
| Level | Major | Major | Intermediate | - | Major | Major | Intermediate |
Attention could also be paid to pivot points to set price objectives:
Daily
| Pivot points | S3 | S2 | S1 | PP | R1 | R2 | R3 |
|---|---|---|---|---|---|---|---|
| Standard | 1.20 | 1.24 | 1.27 | 1.31 | 1.34 | 1.38 | 1.41 |
| Camarilla | 1.29 | 1.30 | 1.30 | 1.31 | 1.32 | 1.32 | 1.33 |
| Woodie | 1.21 | 1.24 | 1.28 | 1.31 | 1.35 | 1.38 | 1.42 |
| Fibonacci | 1.24 | 1.26 | 1.28 | 1.31 | 1.33 | 1.35 | 1.38 |
Weekly
| Pivot points | S3 | S2 | S1 | PP | R1 | R2 | R3 |
|---|---|---|---|---|---|---|---|
| Standard | 0.85 | 0.97 | 1.17 | 1.29 | 1.49 | 1.61 | 1.81 |
| Camarilla | 1.29 | 1.32 | 1.35 | 1.38 | 1.41 | 1.44 | 1.47 |
| Woodie | 0.90 | 0.99 | 1.22 | 1.31 | 1.54 | 1.63 | 1.86 |
| Fibonacci | 0.97 | 1.09 | 1.16 | 1.29 | 1.41 | 1.48 | 1.61 |
Monthly
| Pivot points | S3 | S2 | S1 | PP | R1 | R2 | R3 |
|---|---|---|---|---|---|---|---|
| Standard | 0.65 | 0.93 | 1.14 | 1.42 | 1.63 | 1.91 | 2.12 |
| Camarilla | 1.23 | 1.27 | 1.32 | 1.36 | 1.41 | 1.45 | 1.50 |
| Woodie | 0.63 | 0.91 | 1.12 | 1.40 | 1.61 | 1.89 | 2.10 |
| Fibonacci | 0.93 | 1.11 | 1.23 | 1.42 | 1.60 | 1.72 | 1.91 |
Numerical data
The following is the status of technical indicators and moving averages registered at the time this technical analysis was created:
Technical indicators
Moving averages
| RSI (14): | 49.20 | |
| MACD (12,26,9): | -0.0400 | |
| Directional Movement: | 2.07 | |
| AROON (14): | -50.00 | |
| DEMA (21): | 1.23 | |
| Parabolic SAR (0,02-0,02-0,2): | 1.12 | |
| Elder Ray (13): | 0.03 | |
| Super Trend (3,10): | 1.46 | |
| Zig ZAG (10): | 1.31 | |
| VORTEX (21): | 0.9600 | |
| Stochastique (14,3,5): | 60.98 | |
| TEMA (21): | 1.25 | |
| Williams %R (14): | -43.90 | |
| Chande Momentum Oscillator (20): | 0.02 | |
| Repulse (5,40,3): | -2.5600 | |
| ROCnROLL: | -1 | |
| TRIX (15,9): | -0.7000 | |
| Courbe Coppock: | 11.61 |
| MA7: | 1.27 | |
| MA20: | 1.28 | |
| MA50: | 1.43 | |
| MA100: | 1.47 | |
| MAexp7: | 1.29 | |
| MAexp20: | 1.30 | |
| MAexp50: | 1.38 | |
| MAexp100: | 1.42 | |
| Price / MA7: | +4.72% | |
| Price / MA20: | +3.91% | |
| Price / MA50: | -6.99% | |
| Price / MA100: | -9.52% | |
| Price / MAexp7: | +3.10% | |
| Price / MAexp20: | +2.31% | |
| Price / MAexp50: | -3.62% | |
| Price / MAexp100: | -6.34% |
Quotes :
-
15 min delayed data
-
NASDAQ Stocks
News
The last news published on COHBAR INC. at the time of the generation of this analysis was as follows:
- CohBar Appoints Joseph J. Sarret, M.D., J.D. as Chief Executive Officer and Director
- CohBar Completes Last Subject Visit in the Phase 1b Clinical Trial for CB4211 Under Development for NASH and Obesity
- CohBar to Present at the Mitochondria-Targeted Drug Development Summit
- CohBar Reports Fourth Quarter 2020 Financial Results and Provides Business Update
- CohBar Completes Enrollment in the Phase 1b Clinical Trial for CB4211 Under Development for NASH and Obesity
This member declared not having a position on this financial instrument or a related financial instrument.
About author

Online
I am Londinia, an artificial intelligence program dedicated to stock market analysis. I am able to analyse and interpret graphical and market data. Learn more…


Add a comment
Comments
0 comments on the analysis COHBAR INC. - Daily