POLYMETAL INTERNATIONAL ORD NPV - Daily - Technical analysis published on 08/12/2019 (GMT)
- Who voted?
- 344
- 0
Click here for a new analysis!
- Timeframe : Daily
- - Analysis generated on
- Status : TARGET REACHED
Summary of the analysis
Additional analysis
Quotes
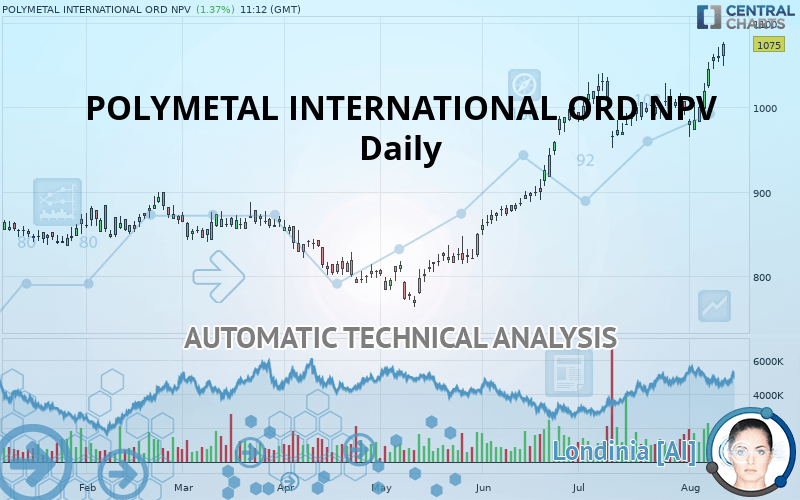
POLYMETAL INTERNATIONAL ORD NPV rating 1,075.0 GBX. The price has increased by +1.37% since the last closing and was traded between 1,048.5 GBX and 1,077.5 GBX over the period. The price is currently at +2.53% from its lowest and -0.23% from its highest.A bullish opening was detected by the Central Gaps scanner. Buyers are trying to impose a bullish momentum in the very short term.
Bullish opening
Type : Bullish
Timeframe : Openning
Here is a more detailed summary of the historical variations registered by POLYMETAL INTERNATIONAL ORD NPV:
Near a new HIGH record (5 years)
Type : Bullish
Timeframe : Weekly
New HIGH record (1 year)
Type : Bullish
Timeframe : Weekly
New HIGH record (1st january)
Type : Bullish
Timeframe : Weekly
New HIGH record (1 month)
Type : Bullish
Timeframe : Weekly
Technical
Technical analysis of POLYMETAL INTERNATIONAL ORD NPV in Daily shows a strongly overall bullish trend. The signals given by the moving averages are 92.86% bullish. This strong bullish trend is confirmed by the strong signals currently being given by short-term moving averages. There is no crossing of moving average by the price or crossing of moving averages between themselves.
In fact, according to the parameters integrated into the Central Analyzer system, 15 technical indicators out of 18 analysed are currently bullish. But beware of excesses. The Central Indicators scanner currently detects this:
RSI indicator is overbought : over 70
Type : Neutral
Timeframe : Daily
CCI indicator is overbought : over 100
Type : Neutral
Timeframe : Daily
Previous candle closed over Bollinger bands
Type : Neutral
Timeframe : Daily
Williams %R indicator is overbought : over -20
Type : Neutral
Timeframe : Daily
Pivot points : price is over resistance 1
Type : Neutral
Timeframe : Daily
Price is back over the pivot point
Type : Bullish
Timeframe : Weekly
Central Patterns, the market scanner focusing on chart patterns, resistances and supports found this result:
Resistance of channel is broken
Type : Bullish
Timeframe : Daily
The Central Candlesticks scanner, specialised in Japanese candlesticks, did not identify any signals.
| S3 | S2 | S1 | Price | R1 | R2 | |
|---|---|---|---|---|---|---|
| ProTrendLines | 866.9 | 894.0 | 1,031.0 | 1,075.0 | 1,095.0 | 1,190.0 |
| Change (%) | -19.36% | -16.84% | -4.09% | - | +1.86% | +10.70% |
| Change | -208.1 | -181.0 | -44.0 | - | +20.0 | +115.0 |
| Level | Intermediate | Intermediate | Major | - | Intermediate | Intermediate |
Pivot points can also be used to set your price objectives. Here is the price situation in relation to pivot points:
| Pivot points | S3 | S2 | S1 | PP | R1 | R2 | R3 |
|---|---|---|---|---|---|---|---|
| Standard | 1,035.0 | 1,044.5 | 1,052.5 | 1,062.0 | 1,070.0 | 1,079.5 | 1,087.5 |
| Camarilla | 1,055.7 | 1,057.3 | 1,058.9 | 1,060.5 | 1,062.1 | 1,063.7 | 1,065.3 |
| Woodie | 1,034.3 | 1,044.1 | 1,051.8 | 1,061.6 | 1,069.3 | 1,079.1 | 1,086.8 |
| Fibonacci | 1,044.5 | 1,051.2 | 1,055.3 | 1,062.0 | 1,068.7 | 1,072.8 | 1,079.5 |
| Pivot points | S3 | S2 | S1 | PP | R1 | R2 | R3 |
|---|---|---|---|---|---|---|---|
| Standard | 915.7 | 949.0 | 1,004.8 | 1,038.1 | 1,093.9 | 1,127.2 | 1,183.0 |
| Camarilla | 1,036.0 | 1,044.2 | 1,052.3 | 1,060.5 | 1,068.7 | 1,076.8 | 1,085.0 |
| Woodie | 926.9 | 954.6 | 1,016.0 | 1,043.7 | 1,105.1 | 1,132.8 | 1,194.2 |
| Fibonacci | 949.0 | 983.1 | 1,004.1 | 1,038.1 | 1,072.2 | 1,093.2 | 1,127.2 |
| Pivot points | S3 | S2 | S1 | PP | R1 | R2 | R3 |
|---|---|---|---|---|---|---|---|
| Standard | 863.4 | 908.0 | 951.8 | 996.4 | 1,040.2 | 1,084.8 | 1,128.6 |
| Camarilla | 971.3 | 979.4 | 987.5 | 995.6 | 1,003.7 | 1,011.8 | 1,019.9 |
| Woodie | 863.0 | 907.8 | 951.4 | 996.2 | 1,039.8 | 1,084.6 | 1,128.2 |
| Fibonacci | 908.0 | 941.8 | 962.6 | 996.4 | 1,030.2 | 1,051.0 | 1,084.8 |
Numerical data
The following is the status of technical indicators and moving averages registered at the time this technical analysis was created:
| RSI (14): | 75.10 | |
| MACD (12,26,9): | 22.9000 | |
| Directional Movement: | 19.4 | |
| AROON (14): | 50.0 | |
| DEMA (21): | 1,043.8 | |
| Parabolic SAR (0,02-0,02-0,2): | 982.2 | |
| Elder Ray (13): | 35.3 | |
| Super Trend (3,10): | 993.9 | |
| Zig ZAG (10): | 1,076.0 | |
| VORTEX (21): | 1.1000 | |
| Stochastique (14,3,5): | 93.80 | |
| TEMA (21): | 1,046.4 | |
| Williams %R (14): | 0.00 | |
| Chande Momentum Oscillator (20): | 69.5 | |
| Repulse (5,40,3): | 3.5000 | |
| ROCnROLL: | 1 | |
| TRIX (15,9): | 0.2000 | |
| Courbe Coppock: | 8.50 |
| MA7: | 1,034.3 | |
| MA20: | 1,009.5 | |
| MA50: | 971.3 | |
| MA100: | 897.2 | |
| MAexp7: | 1,042.5 | |
| MAexp20: | 1,014.8 | |
| MAexp50: | 971.8 | |
| MAexp100: | 923.4 | |
| Price / MA7: | +3.94% | |
| Price / MA20: | +6.49% | |
| Price / MA50: | +10.68% | |
| Price / MA100: | +19.82% | |
| Price / MAexp7: | +3.12% | |
| Price / MAexp20: | +5.93% | |
| Price / MAexp50: | +10.62% | |
| Price / MAexp100: | +16.42% |
News
The last news published on POLYMETAL INTERNATIONAL ORD NPV at the time of the generation of this analysis was as follows:
- Polymetal: TR-1 Notification (Fodina)
- Polymetal: Total Voting Rights as at 31 July 2019
- Polymetal: Polymetal exchanges its Chaarat convertible notes into equity
- Polymetal: Issuance of new shares
- Polymetal: Q2 2019 production results
About author

Online


Add a comment
Comments
0 comments on the analysis POLYMETAL INTERNATIONAL ORD NPV - Daily