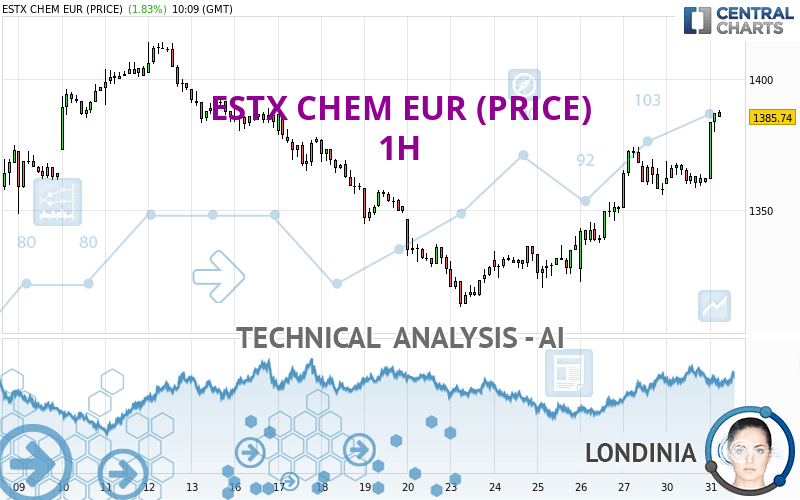
ESTX CHEM EUR (PRICE) - 1H - Technical analysis published on 10/31/2023 (GMT)
- 87
- 0
Click here for a new analysis!
- Timeframe : 1H
- - Analysis generated on
- Status : TARGET REACHED

Summary of the analysis

Additional analysis
Quotes
The ESTX CHEM EUR (PRICE) rating is 1,386.99 EUR. On the day, this instrument gained +1.93% and was between 1,361.96 EUR and 1,388.42 EUR. This implies that the price is at +1.84% from its lowest and at -0.10% from its highest.The Central Gaps scanner detects a bullish opening marking the presence of buyers ahead of sellers at the opening but not sufficiently marked to allow the price to register a quotation gap.
Bullish opening
Type : Bullish
Timeframe : Openning
So that you have an overall view of the price change, here is a table showing the variations over several periods:
Near a new LOW record (1 year)
Type : Bearish
Timeframe : Weekly
Near a new LOW record (1st january)
Type : Bearish
Timeframe : Weekly
Near a new LOW record (1 month)
Type : Bearish
Timeframe : Weekly
Technical
Technical analysis of this 1H chart of ESTX CHEM EUR (PRICE) indicates that the overall trend is strongly bullish. The signals given by the moving averages are 85.71% bullish. This strong bullish trend is confirmed by the strong signals currently being given by short-term moving averages. The Central Indicators scanner does not detect any result on moving averages that would impact this trend.
The probability of a further increase is high given the direction of the technical indicators.
But beware of excesses. The Central Indicators scanner currently detects this:
RSI indicator is overbought : over 70
Type : Neutral
Timeframe : 1 hour
CCI indicator is overbought : over 100
Type : Neutral
Timeframe : 1 hour
Previous candle closed over Bollinger bands
Type : Neutral
Timeframe : 1 hour
Williams %R indicator is overbought : over -20
Type : Neutral
Timeframe : 1 hour
Pivot points : price is over resistance 1
Type : Neutral
Timeframe : Weekly
Pivot points : price is over resistance 3
Type : Neutral
Timeframe : 1 hour
No signals are given by Central Patterns, a market scanner specialised in chart patterns, resistances and supports.
The Central Candlesticks scanner, specialised in Japanese candlesticks, did not identify any signals.
| S3 | S2 | S1 | Price | R1 | R2 | R3 | |
|---|---|---|---|---|---|---|---|
| ProTrendLines | 1,336.73 | 1,355.85 | 1,370.20 | 1,386.99 | 1,389.04 | 1,400.68 | 1,414.36 |
| Change (%) | -3.62% | -2.25% | -1.21% | - | +0.15% | +0.99% | +1.97% |
| Change | -50.26 | -31.14 | -16.79 | - | +2.05 | +13.69 | +27.37 |
| Level | Minor | Major | Major | - | Minor | Intermediate | Intermediate |
Attention could also be paid to pivot points to set price objectives:
| Pivot points | S3 | S2 | S1 | PP | R1 | R2 | R3 |
|---|---|---|---|---|---|---|---|
| Standard | 1,346.14 | 1,352.34 | 1,356.55 | 1,362.75 | 1,366.96 | 1,373.16 | 1,377.37 |
| Camarilla | 1,357.91 | 1,358.86 | 1,359.82 | 1,360.77 | 1,361.72 | 1,362.68 | 1,363.63 |
| Woodie | 1,345.16 | 1,351.84 | 1,355.57 | 1,362.25 | 1,365.98 | 1,372.66 | 1,376.39 |
| Fibonacci | 1,352.34 | 1,356.31 | 1,358.77 | 1,362.75 | 1,366.72 | 1,369.18 | 1,373.16 |
| Pivot points | S3 | S2 | S1 | PP | R1 | R2 | R3 |
|---|---|---|---|---|---|---|---|
| Standard | 1,261.28 | 1,287.20 | 1,322.48 | 1,348.40 | 1,383.68 | 1,409.60 | 1,444.88 |
| Camarilla | 1,340.93 | 1,346.54 | 1,352.15 | 1,357.76 | 1,363.37 | 1,368.98 | 1,374.59 |
| Woodie | 1,265.96 | 1,289.54 | 1,327.16 | 1,350.74 | 1,388.36 | 1,411.94 | 1,449.56 |
| Fibonacci | 1,287.20 | 1,310.58 | 1,325.02 | 1,348.40 | 1,371.78 | 1,386.22 | 1,409.60 |
| Pivot points | S3 | S2 | S1 | PP | R1 | R2 | R3 |
|---|---|---|---|---|---|---|---|
| Standard | 1,241.86 | 1,305.72 | 1,353.02 | 1,416.88 | 1,464.18 | 1,528.04 | 1,575.34 |
| Camarilla | 1,369.74 | 1,379.93 | 1,390.12 | 1,400.31 | 1,410.50 | 1,420.69 | 1,430.88 |
| Woodie | 1,233.57 | 1,301.58 | 1,344.73 | 1,412.74 | 1,455.89 | 1,523.90 | 1,567.05 |
| Fibonacci | 1,305.72 | 1,348.19 | 1,374.42 | 1,416.88 | 1,459.35 | 1,485.58 | 1,528.04 |
Numerical data
The following are the details of the technical indicators and moving averages that were collected to generate this technical analysis:
| RSI (14): | 71.43 | |
| MACD (12,26,9): | 7.1400 | |
| Directional Movement: | 26.72 | |
| AROON (14): | 78.57 | |
| DEMA (21): | 1,373.12 | |
| Parabolic SAR (0,02-0,02-0,2): | 1,356.51 | |
| Elder Ray (13): | 15.36 | |
| Super Trend (3,10): | 1,361.06 | |
| Zig ZAG (10): | 1,384.91 | |
| VORTEX (21): | 1.2000 | |
| Stochastique (14,3,5): | 76.40 | |
| TEMA (21): | 1,375.26 | |
| Williams %R (14): | -4.30 | |
| Chande Momentum Oscillator (20): | 26.98 | |
| Repulse (5,40,3): | 1.6400 | |
| ROCnROLL: | 1 | |
| TRIX (15,9): | 0.0700 | |
| Courbe Coppock: | 0.96 |
| MA7: | 1,350.49 | |
| MA20: | 1,364.94 | |
| MA50: | 1,403.55 | |
| MA100: | 1,416.52 | |
| MAexp7: | 1,372.06 | |
| MAexp20: | 1,363.88 | |
| MAexp50: | 1,355.03 | |
| MAexp100: | 1,356.36 | |
| Price / MA7: | +2.70% | |
| Price / MA20: | +1.62% | |
| Price / MA50: | -1.18% | |
| Price / MA100: | -2.08% | |
| Price / MAexp7: | +1.09% | |
| Price / MAexp20: | +1.69% | |
| Price / MAexp50: | +2.36% | |
| Price / MAexp100: | +2.26% |
About author
Online


Add a comment
Comments
0 comments on the analysis ESTX CHEM EUR (PRICE) - 1H