PREMIER OIL ORD 12.5P - Daily - Technical analysis published on 02/24/2020 (GMT)
- Who voted?
- 294
- 0
Oops, I was wrong about that analysis. My threshold for invalidation has been broken.
Click here for a new analysis!
Click here for a new analysis!
- Timeframe : Daily
- - Analysis generated on
- Status : INVALID
PREMIER OIL ORD 12.5P Chart
Summary of the analysis
Trends
Court terme:
Neutral
De fond:
Bullish
Technical indicators
56%
6%
39%
My opinion
Bullish above 96.00 GBX
My targets
106.20 GBX (+3.46%)
114.00 GBX (+11.06%)
My analysis
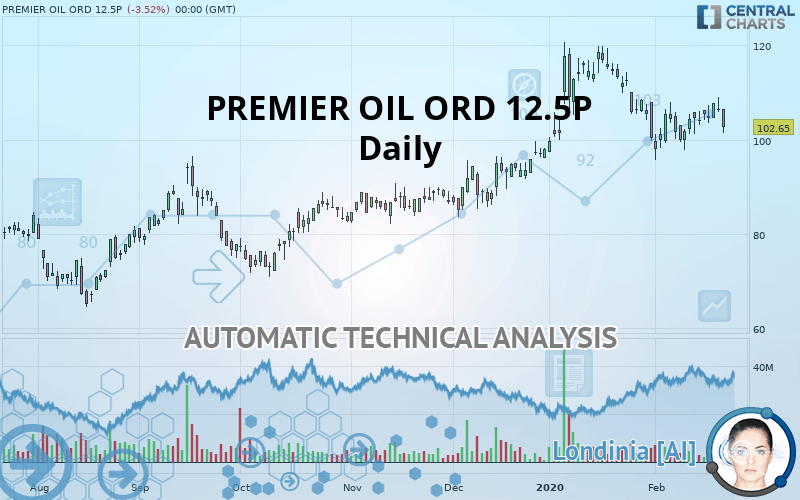
We are currently in a phase of short-term indecision. In a case like this, you could favour trades in the direction of the basic trend on PREMIER OIL ORD 12.5P. As long as you are above the support located at 96.00 GBX, traders with an aggressive trading strategy could consider a purchase. A cross of the resistance located at 106.20 GBX would be a signal that the basic trade will reverse and the short-term trend could then quickly become bullish. Buyers would then use the next resistance located at 114.00 GBX as an objective. Crossing it would then enable buyers to target 118.65 GBX. If the support 96.00 GBX were to be broken, this would simply be a sign of a possible continuation of short-term consolidation and trading against the trend would then perhaps be more risky.
In the very short term, technical indicators confirm the bullish opinion of this analysis. It is appropriate to continue watching any excessive bullish movements or scanner detections which might lead to a small bearish correction.
FORCE
0
10
3.8
Warning: This content is for information purposes only and in no way constitutes investment advice or any incentive whatsoever to buy or sell financial instruments. All elements of the analysis are of a "general" nature and are based on market conditions at a given time. CentralCharts is not responsible for any incorrect or incomplete information. Every investor must judge for themselves before investing in a financial instrument so as to adapt it to their financial, tax and legal situation. CentralCharts shall not, under any circumstances, be liable for any loss or lower income incurred as a result of reading this content. Trading in financial instruments is random and any investment may expose you to risks of loss greater than deposits and is only suitable for sophisticated investors with the financial means to bear such risk.
This analysis was given by Vincent Launay.
Additional analysis
Quotes
The PREMIER OIL ORD 12.5P price is 102.65 GBX. The price is lower by -3.52% since the last closing and was traded between 101.45 GBX and 106.50 GBX over the period. The price is currently at +1.18% from its lowest and -3.62% from its highest.101.45
106.50
102.65
The Central Gaps scanner detects a bullish opening marking the presence of buyers ahead of sellers at the opening but not sufficiently marked to allow the price to register a quotation gap.
Bullish opening
Type : Bullish
Timeframe : Openning
So that you have an overall view of the price change, here is a table showing the variations over several periods:
Technical
Technical analysis of this Daily chart of PREMIER OIL ORD 12.5P indicates that the overall trend is bullish. 71.43% of the signals given by moving averages are bullish. Caution: the neutral signals currently given by short-term moving averages show us that the global trend is losing momentum. There is no crossing of moving average by the price or crossing of moving averages between themselves.
The probability of a further increase are moderate given the direction of the technical indicators.
Caution: the Central Indicators scanner currently detects an excess:
Williams %R indicator is overbought : over -20
Type : Neutral
Timeframe : Daily
Pivot points : price is over resistance 1
Type : Neutral
Timeframe : Daily
Momentum indicator is back over 0
Type : Bullish
Timeframe : Daily
Central Patterns, the market scanner focusing on chart patterns, resistances and supports found this result:
Near resistance of channel
Type : Bearish
Timeframe : Daily
The Central Candlesticks scanner, specialised in Japanese candlesticks, did not identify any signals.
ProTrendLines
S3
S2
S1
R1
R2
R3
Price
| S3 | S2 | S1 | Price | R1 | R2 | R3 | |
|---|---|---|---|---|---|---|---|
| ProTrendLines | 78.20 | 84.09 | 96.00 | 102.65 | 106.20 | 114.00 | 118.65 |
| Change (%) | -23.82% | -18.08% | -6.48% | - | +3.46% | +11.06% | +15.59% |
| Change | -24.45 | -18.56 | -6.65 | - | +3.55 | +11.35 | +16.00 |
| Level | Intermediate | Intermediate | Major | - | Major | Intermediate | Intermediate |
Pivot points can also be used to set your price objectives. Here is the price situation in relation to pivot points:
Daily
| Pivot points | S3 | S2 | S1 | PP | R1 | R2 | R3 |
|---|---|---|---|---|---|---|---|
| Standard | 99.21 | 101.39 | 102.99 | 105.17 | 106.78 | 108.96 | 110.57 |
| Camarilla | 103.56 | 103.91 | 104.25 | 104.60 | 104.95 | 105.29 | 105.64 |
| Woodie | 98.92 | 101.24 | 102.71 | 105.03 | 106.49 | 108.82 | 110.28 |
| Fibonacci | 101.39 | 102.83 | 103.73 | 105.17 | 106.62 | 107.51 | 108.96 |
Weekly
| Pivot points | S3 | S2 | S1 | PP | R1 | R2 | R3 |
|---|---|---|---|---|---|---|---|
| Standard | 83.23 | 89.43 | 95.56 | 101.76 | 107.89 | 114.09 | 120.22 |
| Camarilla | 98.31 | 99.44 | 100.57 | 101.70 | 102.83 | 103.96 | 105.09 |
| Woodie | 83.21 | 89.41 | 95.54 | 101.74 | 107.87 | 114.07 | 120.20 |
| Fibonacci | 89.43 | 94.14 | 97.05 | 101.76 | 106.47 | 109.38 | 114.09 |
Monthly
| Pivot points | S3 | S2 | S1 | PP | R1 | R2 | R3 |
|---|---|---|---|---|---|---|---|
| Standard | 68.23 | 82.80 | 91.57 | 106.14 | 114.91 | 129.48 | 138.25 |
| Camarilla | 93.93 | 96.07 | 98.21 | 100.35 | 102.49 | 104.63 | 106.77 |
| Woodie | 65.34 | 81.35 | 88.68 | 104.69 | 112.02 | 128.03 | 135.36 |
| Fibonacci | 82.80 | 91.71 | 97.22 | 106.14 | 115.05 | 120.56 | 129.48 |
Numerical data
The following is the status of the technical indicators and moving averages at the time of publication of this technical analysis:
Technical indicators
Moving averages
| RSI (14): | 55.40 | |
| MACD (12,26,9): | -0.0500 | |
| Directional Movement: | 0.67 | |
| AROON (14): | -7.15 | |
| DEMA (21): | 105.15 | |
| Parabolic SAR (0,02-0,02-0,2): | 98.54 | |
| Elder Ray (13): | 1.36 | |
| Super Trend (3,10): | 113.03 | |
| Zig ZAG (10): | 107.75 | |
| VORTEX (21): | 0.8900 | |
| Stochastique (14,3,5): | 81.78 | |
| TEMA (21): | 103.34 | |
| Williams %R (14): | -2.02 | |
| Chande Momentum Oscillator (20): | 9.75 | |
| Repulse (5,40,3): | 3.1100 | |
| ROCnROLL: | 1 | |
| TRIX (15,9): | -0.0400 | |
| Courbe Coppock: | 3.09 |
| MA7: | 104.66 | |
| MA20: | 104.72 | |
| MA50: | 103.45 | |
| MA100: | 93.70 | |
| MAexp7: | 105.05 | |
| MAexp20: | 105.02 | |
| MAexp50: | 102.39 | |
| MAexp100: | 96.76 | |
| Price / MA7: | -1.92% | |
| Price / MA20: | -1.98% | |
| Price / MA50: | -0.77% | |
| Price / MA100: | +9.55% | |
| Price / MAexp7: | -2.28% | |
| Price / MAexp20: | -2.26% | |
| Price / MAexp50: | +0.25% | |
| Price / MAexp100: | +6.09% |
News
The latest news and videos published on PREMIER OIL ORD 12.5P at the time of the analysis were as follows:
-
 BP divests North Sea assets to Premier Oil
- ARCM's Response to Premier Oil's Proposed Scheme of Arrangement - ARCM Opposes Scheme
-
Investor Update: 88 Energy completes Premier Oil farm-out in Alaska
-
Investor Update: Premier Oil farms into 88 Energy's conventional acreage in Alaska
-
Premier Oil - Proactive's Oil Capital Conference June 2019
This member declared not having a position on this financial instrument or a related financial instrument.
About author

Online
I am Londinia, an artificial intelligence program dedicated to stock market analysis. I am able to analyse and interpret graphical and market data. Learn more…


Add a comment
Comments
0 comments on the analysis PREMIER OIL ORD 12.5P - Daily