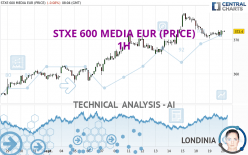
STXE 600 MEDIA EUR (PRICE) - 1H - Technical analysis published on 09/20/2023 (GMT)
- 105
- 0
Click here for a new analysis!
- Timeframe : 1H
- - Analysis generated on
- Status : TARGET REACHED

Summary of the analysis

Additional analysis
Quotes
The STXE 600 MEDIA EUR (PRICE) price is 372.63 EUR. On the day, this instrument lost -0.02% with the lowest point at 371.52 EUR and the highest point at 372.63 EUR. The deviation from the price is +0.30% for the low point and 0% for the high point.The Central Gaps scanner detects a bearish opening marking the presence of sellers ahead of buyers at the opening but not sufficiently marked to allow the price to register a quotation gap.
Bearish opening
Type : Bearish
Timeframe : Openning
A study of price movements over other periods shows the following variations:
Near a new HIGH record (5 years)
Type : Bullish
Timeframe : Weekly
Near a new HIGH record (1 year)
Type : Bullish
Timeframe : Weekly
Near a new HIGH record (1st january)
Type : Bullish
Timeframe : Weekly
Near a new HIGH record (1 month)
Type : Bullish
Timeframe : Weekly
Technical
A technical analysis in 1H of this STXE 600 MEDIA EUR (PRICE) chart shows a strongly bullish trend. 85.71% of the signals given by moving averages are bullish. The slightly bullish signals given by the short-term moving averages show a weakening of the global trend. The Central Indicators scanner detects bullish and bearish signals on moving averages that could impact this trend:
Bullish trend reversal : adaptative moving average 20
Type : Bullish
Timeframe : 1 hour
Bearish price crossover with Moving Average 20
Type : Bearish
Timeframe : 1 hour
Bearish price crossover with adaptative moving average 20
Type : Bearish
Timeframe : 1 hour
In fact, 10 technical indicators on 18 studied are currently bullish. Central Indicators, the detector scanner for these technical indicators has recently detected several signals:
RSI indicator is back under 50
Type : Bearish
Timeframe : 1 hour
Price is back under the pivot point
Type : Bearish
Timeframe : Weekly
Central Patterns, the scanner specializing in chart patterns, did not identify any signals.
Central Candlesticks, the scanner specialised in Japanese candlesticks, detects a bearish signal that could support the hypothesis of a small drop in the very short term:
Bearish harami
Type : Bearish
Timeframe : 1 hour
| S3 | S2 | S1 | Price | R1 | R2 | |
|---|---|---|---|---|---|---|
| ProTrendLines | 350.32 | 356.55 | 367.11 | 372.63 | 373.88 | 377.80 |
| Change (%) | -5.99% | -4.32% | -1.48% | - | +0.34% | +1.39% |
| Change | -22.31 | -16.08 | -5.52 | - | +1.25 | +5.17 |
| Level | Intermediate | Intermediate | Major | - | Major | Intermediate |
To determine price objectives, it is also possible to use the pivot points. Here is the price position in relation to pivot points:
| Pivot points | S3 | S2 | S1 | PP | R1 | R2 | R3 |
|---|---|---|---|---|---|---|---|
| Standard | 368.63 | 369.48 | 371.09 | 371.94 | 373.55 | 374.40 | 376.01 |
| Camarilla | 372.02 | 372.25 | 372.48 | 372.70 | 372.93 | 373.15 | 373.38 |
| Woodie | 369.01 | 369.67 | 371.47 | 372.13 | 373.93 | 374.59 | 376.39 |
| Fibonacci | 369.48 | 370.42 | 371.00 | 371.94 | 372.88 | 373.46 | 374.40 |
| Pivot points | S3 | S2 | S1 | PP | R1 | R2 | R3 |
|---|---|---|---|---|---|---|---|
| Standard | 356.30 | 361.00 | 368.40 | 373.10 | 380.50 | 385.20 | 392.60 |
| Camarilla | 372.47 | 373.58 | 374.69 | 375.80 | 376.91 | 378.02 | 379.13 |
| Woodie | 357.65 | 361.68 | 369.75 | 373.78 | 381.85 | 385.88 | 393.95 |
| Fibonacci | 361.00 | 365.62 | 368.48 | 373.10 | 377.72 | 380.58 | 385.20 |
| Pivot points | S3 | S2 | S1 | PP | R1 | R2 | R3 |
|---|---|---|---|---|---|---|---|
| Standard | 329.73 | 338.90 | 348.71 | 357.88 | 367.69 | 376.86 | 386.67 |
| Camarilla | 353.31 | 355.05 | 356.79 | 358.53 | 360.27 | 362.01 | 363.75 |
| Woodie | 330.06 | 339.06 | 349.04 | 358.04 | 368.02 | 377.02 | 387.00 |
| Fibonacci | 338.90 | 346.15 | 350.63 | 357.88 | 365.13 | 369.61 | 376.86 |
Numerical data
The following are the details of the technical indicators and moving averages that were collected to generate this technical analysis:
| RSI (14): | 50.41 | |
| MACD (12,26,9): | -0.1000 | |
| Directional Movement: | 0.76 | |
| AROON (14): | -35.71 | |
| DEMA (21): | 372.19 | |
| Parabolic SAR (0,02-0,02-0,2): | 370.47 | |
| Elder Ray (13): | -0.12 | |
| Super Trend (3,10): | 374.44 | |
| Zig ZAG (10): | 372.07 | |
| VORTEX (21): | 0.8300 | |
| Stochastique (14,3,5): | 59.50 | |
| TEMA (21): | 371.45 | |
| Williams %R (14): | -25.20 | |
| Chande Momentum Oscillator (20): | 0.74 | |
| Repulse (5,40,3): | 0.3100 | |
| ROCnROLL: | 1 | |
| TRIX (15,9): | 0.0000 | |
| Courbe Coppock: | 0.70 |
| MA7: | 371.58 | |
| MA20: | 364.02 | |
| MA50: | 361.65 | |
| MA100: | 356.61 | |
| MAexp7: | 372.10 | |
| MAexp20: | 372.22 | |
| MAexp50: | 371.26 | |
| MAexp100: | 368.51 | |
| Price / MA7: | +0.28% | |
| Price / MA20: | +2.37% | |
| Price / MA50: | +3.04% | |
| Price / MA100: | +4.49% | |
| Price / MAexp7: | +0.14% | |
| Price / MAexp20: | +0.11% | |
| Price / MAexp50: | +0.37% | |
| Price / MAexp100: | +1.12% |
About author
Online


Add a comment
Comments
0 comments on the analysis STXE 600 MEDIA EUR (PRICE) - 1H