ASML HOLDING N.V. NEW YORK REGISTRY SHA - Daily - Technical analysis published on 07/21/2022 (GMT)
- 222
- 0
Click here for a new analysis!
- Timeframe : Daily
- - Analysis generated on
- Status : LEVEL MAINTAINED

Summary of the analysis

Additional analysis
Quotes
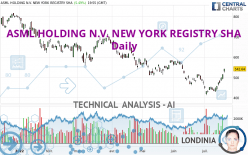
The ASML HOLDING N.V. NEW YORK REGISTRY SHA rating is 542.70 USD. On the day, this instrument gained +5.50% and was between 524.60 USD and 542.81 USD. This implies that the price is at +3.45% from its lowest and at -0.02% from its highest.The Central Gaps scanner detects the formation of a bullish gap marking the strong presence of buyers against sellers at the opening. This formed a quotation gap.
Opening Gap UP
Type : Bullish
Timeframe : Openning
Here is a more detailed summary of the historical variations registered by ASML HOLDING N.V. NEW YORK REGISTRY SHA:
New HIGH record (1 month)
Type : Bullish
Timeframe : Weekly
Technical
A technical analysis in Daily of this ASML HOLDING N.V. NEW YORK REGISTRY SHA chart shows a neutral trend. The trend could quickly turn bullish due to the strong bullish signals currently being given by short-term moving averages. The Central Indicators market scanner is currently detecting several bullish signals that could impact this trend:
Bullish trend reversal : adaptative moving average 50
Type : Bullish
Timeframe : Daily
Bullish price crossover with adaptative moving average 50
Type : Bullish
Timeframe : Daily
An assessment of technical indicators shows a strong bullish signal.
But beware of excesses. The Central Indicators scanner currently detects this:
CCI indicator is overbought : over 100
Type : Neutral
Timeframe : Daily
Williams %R indicator is overbought : over -20
Type : Neutral
Timeframe : Daily
Pivot points : price is over resistance 2
Type : Neutral
Timeframe : Daily
Pivot points : price is over resistance 3
Type : Neutral
Timeframe : Weekly
Central Patterns, the market scanner focusing on chart patterns, resistances and supports found these results:
Near resistance of triangle
Type : Bearish
Timeframe : Daily
Resistance of channel is broken
Type : Bullish
Timeframe : Daily
The presence of a bullish Japanese candlestick pattern detected by Central Candlesticks that could cause a very short term rebound was also detected:
Upside gap
Type : Bullish
Timeframe : Daily
| S3 | S2 | S1 | Price | R1 | R2 | R3 | |
|---|---|---|---|---|---|---|---|
| ProTrendLines | 343.65 | 452.95 | 512.66 | 542.70 | 596.63 | 629.99 | 705.23 |
| Change (%) | -36.68% | -16.54% | -5.54% | - | +9.94% | +16.08% | +29.95% |
| Change | -199.05 | -89.75 | -30.04 | - | +53.93 | +87.29 | +162.53 |
| Level | Intermediate | Intermediate | Intermediate | - | Minor | Intermediate | Major |
Pivot points can also be used to set your price objectives. Here is the price situation in relation to pivot points:
| Pivot points | S3 | S2 | S1 | PP | R1 | R2 | R3 |
|---|---|---|---|---|---|---|---|
| Standard | 471.60 | 481.10 | 497.76 | 507.26 | 523.92 | 533.42 | 550.08 |
| Camarilla | 507.23 | 509.62 | 512.02 | 514.42 | 516.82 | 519.22 | 521.61 |
| Woodie | 475.18 | 482.89 | 501.34 | 509.05 | 527.50 | 535.21 | 553.66 |
| Fibonacci | 481.10 | 491.09 | 497.27 | 507.26 | 517.25 | 523.43 | 533.42 |
| Pivot points | S3 | S2 | S1 | PP | R1 | R2 | R3 |
|---|---|---|---|---|---|---|---|
| Standard | 398.21 | 413.76 | 444.69 | 460.24 | 491.17 | 506.72 | 537.65 |
| Camarilla | 462.85 | 467.11 | 471.37 | 475.63 | 479.89 | 484.15 | 488.41 |
| Woodie | 405.91 | 417.61 | 452.39 | 464.09 | 498.87 | 510.57 | 545.35 |
| Fibonacci | 413.76 | 431.51 | 442.48 | 460.24 | 477.99 | 488.96 | 506.72 |
| Pivot points | S3 | S2 | S1 | PP | R1 | R2 | R3 |
|---|---|---|---|---|---|---|---|
| Standard | 309.06 | 385.45 | 430.67 | 507.06 | 552.28 | 628.67 | 673.89 |
| Camarilla | 442.44 | 453.59 | 464.73 | 475.88 | 487.03 | 498.18 | 509.32 |
| Woodie | 293.47 | 377.66 | 415.08 | 499.27 | 536.69 | 620.88 | 658.30 |
| Fibonacci | 385.45 | 431.91 | 460.61 | 507.06 | 553.52 | 582.22 | 628.67 |
Numerical data
The following are the details of the technical indicators and moving averages that were collected to generate this technical analysis:
| RSI (14): | 63.95 | |
| MACD (12,26,9): | -2.6900 | |
| Directional Movement: | 15.93 | |
| AROON (14): | 85.71 | |
| DEMA (21): | 473.76 | |
| Parabolic SAR (0,02-0,02-0,2): | 429.48 | |
| Elder Ray (13): | 48.95 | |
| Super Trend (3,10): | 467.60 | |
| Zig ZAG (10): | 540.85 | |
| VORTEX (21): | 0.9600 | |
| Stochastique (14,3,5): | 98.26 | |
| TEMA (21): | 488.96 | |
| Williams %R (14): | -0.26 | |
| Chande Momentum Oscillator (20): | 108.85 | |
| Repulse (5,40,3): | 9.4800 | |
| ROCnROLL: | 1 | |
| TRIX (15,9): | -0.4700 | |
| Courbe Coppock: | 6.31 |
| MA7: | 486.81 | |
| MA20: | 472.79 | |
| MA50: | 510.46 | |
| MA100: | 563.94 | |
| MAexp7: | 496.22 | |
| MAexp20: | 483.71 | |
| MAexp50: | 510.57 | |
| MAexp100: | 557.75 | |
| Price / MA7: | +11.48% | |
| Price / MA20: | +14.79% | |
| Price / MA50: | +6.32% | |
| Price / MA100: | -3.77% | |
| Price / MAexp7: | +9.35% | |
| Price / MAexp20: | +12.18% | |
| Price / MAexp50: | +6.28% | |
| Price / MAexp100: | -2.71% |
About author
Online


Add a comment
Comments
0 comments on the analysis ASML HOLDING N.V. NEW YORK REGISTRY SHA - Daily