PROOFPOINT INC. - Daily - Technical analysis published on 11/07/2019 (GMT)
- Who voted?
- 183
- 0
I am delighted to see that my first price objective has been achieved. I hope you've taken advantage of it.
Click here for a new analysis!
Click here for a new analysis!
- Timeframe : Daily
- - Analysis generated on
- Status : TARGET REACHED
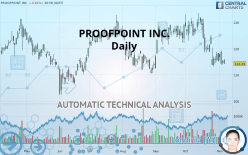

PROOFPOINT INC. Chart
Summary of the analysis
Trends
Court terme:
Strongly bearish
De fond:
Bearish
Technical indicators
22%
61%
17%
My opinion
Bearish under 117.69 USD
My targets
113.78 USD (-0.48%)
110.71 USD (-3.17%)
My analysis
All elements being clearly bearish, it would be possible for traders to trade only short positions (for sale) on PROOFPOINT INC. as long as the price remains well below 117.69 USD. The sellers” bearish objective is set at 113.78 USD. A bearish break of this support would revive the bearish momentum. The sellers could then target the support located at 110.71 USD. In case of crossing, the next objective would be the support located at 107.18 USD.
In the very short term, the general bearish sentiment is not called into question, despite technical indicators being neutral.
FORCE
0
10
4.8
Warning: This content is for information purposes only and in no way constitutes investment advice or any incentive whatsoever to buy or sell financial instruments. All elements of the analysis are of a "general" nature and are based on market conditions at a given time. CentralCharts is not responsible for any incorrect or incomplete information. Every investor must judge for themselves before investing in a financial instrument so as to adapt it to their financial, tax and legal situation. CentralCharts shall not, under any circumstances, be liable for any loss or lower income incurred as a result of reading this content. Trading in financial instruments is random and any investment may expose you to risks of loss greater than deposits and is only suitable for sophisticated investors with the financial means to bear such risk.
This analysis was given by Vincent Launay.
Additional analysis
Quotes
The PROOFPOINT INC. price is 114.33 USD. The price is lower by -0.81% since the last closing and was traded between 114.22 USD and 116.14 USD over the period. The price is currently at +0.10% from its lowest and -1.56% from its highest.114.22
116.14
114.33
A bullish gap was detected at the opening by the Central Gaps scanner. There are a lot of buyers and they have the upper hand in the very short term.
Opening Gap UP
Type : Bullish
Timeframe : Openning
Here is a more detailed summary of the historical variations registered by PROOFPOINT INC.:
Near a new LOW record (1 month)
Type : Bearish
Timeframe : Weekly
Technical
A technical analysis in Daily of this PROOFPOINT INC. chart shows a bearish trend. The signals given by moving averages are 67.86% bearish. This bearish trend is reinforced by the strong signals currently being given by short-term moving averages. The Central Indicators scanner does not detect any result on moving averages that would impact this trend.
The technical indicators are generally neutral. They do not provide relevant information on the direction of future price movements.
But beware of excesses. The Central Indicators scanner currently detects this:
MACD indicator: bullish divergence
Type : Bullish
Timeframe : Daily
Williams %R indicator is oversold : under -80
Type : Neutral
Timeframe : Daily
Pivot points : price is under support 1
Type : Neutral
Timeframe : Weekly
Price is back over the pivot point
Type : Bullish
Timeframe : Daily
Price is back over the pivot point
Type : Bullish
Timeframe : Weekly
No signals are given by Central Patterns, a market scanner specialised in chart patterns, resistances and supports.
For a small rebound in the very short term, the Central Candlesticks scanner currently notes the presence of this bullish pattern in Japanese candlesticks:
Bullish harami
Type : Bullish
Timeframe : Daily
ProTrendLines
S3
S2
S1
R1
R2
R3
Price
| S3 | S2 | S1 | Price | R1 | R2 | R3 | |
|---|---|---|---|---|---|---|---|
| ProTrendLines | 107.18 | 110.71 | 113.78 | 114.33 | 117.69 | 121.20 | 127.92 |
| Change (%) | -6.25% | -3.17% | -0.48% | - | +2.94% | +6.01% | +11.89% |
| Change | -7.15 | -3.62 | -0.55 | - | +3.36 | +6.87 | +13.59 |
| Level | Minor | Major | Major | - | Intermediate | Minor | Minor |
To determine price objectives, it is also possible to use the pivot points. Here is the price position in relation to pivot points:
Daily
| Pivot points | S3 | S2 | S1 | PP | R1 | R2 | R3 |
|---|---|---|---|---|---|---|---|
| Standard | 112.56 | 113.23 | 114.25 | 114.92 | 115.93 | 116.61 | 117.62 |
| Camarilla | 114.80 | 114.95 | 115.11 | 115.26 | 115.42 | 115.57 | 115.72 |
| Woodie | 112.73 | 113.32 | 114.42 | 115.00 | 116.10 | 116.69 | 117.79 |
| Fibonacci | 113.23 | 113.88 | 114.27 | 114.92 | 115.56 | 115.96 | 116.61 |
Weekly
| Pivot points | S3 | S2 | S1 | PP | R1 | R2 | R3 |
|---|---|---|---|---|---|---|---|
| Standard | 108.72 | 110.92 | 114.37 | 116.57 | 120.02 | 122.22 | 125.67 |
| Camarilla | 116.26 | 116.77 | 117.29 | 117.81 | 118.33 | 118.85 | 119.36 |
| Woodie | 109.34 | 111.23 | 114.99 | 116.88 | 120.64 | 122.53 | 126.29 |
| Fibonacci | 110.92 | 113.08 | 114.42 | 116.57 | 118.73 | 120.07 | 122.22 |
Monthly
| Pivot points | S3 | S2 | S1 | PP | R1 | R2 | R3 |
|---|---|---|---|---|---|---|---|
| Standard | 87.36 | 100.24 | 107.81 | 120.69 | 128.26 | 141.14 | 148.71 |
| Camarilla | 109.75 | 111.62 | 113.50 | 115.37 | 117.25 | 119.12 | 120.99 |
| Woodie | 84.70 | 98.91 | 105.15 | 119.36 | 125.60 | 139.81 | 146.05 |
| Fibonacci | 100.24 | 108.06 | 112.88 | 120.69 | 128.51 | 133.33 | 141.14 |
Numerical data
The following are the details of the technical indicators and moving averages that were collected to generate this technical analysis:
Technical indicators
Moving averages
| RSI (14): | 40.12 | |
| MACD (12,26,9): | -2.8200 | |
| Directional Movement: | -7.82 | |
| AROON (14): | -50.00 | |
| DEMA (21): | 116.09 | |
| Parabolic SAR (0,02-0,02-0,2): | 122.32 | |
| Elder Ray (13): | -2.56 | |
| Super Trend (3,10): | 126.58 | |
| Zig ZAG (10): | 114.33 | |
| VORTEX (21): | 0.8300 | |
| Stochastique (14,3,5): | 9.15 | |
| TEMA (21): | 113.63 | |
| Williams %R (14): | -90.42 | |
| Chande Momentum Oscillator (20): | -5.66 | |
| Repulse (5,40,3): | -3.3200 | |
| ROCnROLL: | 2 | |
| TRIX (15,9): | -0.2500 | |
| Courbe Coppock: | 16.36 |
| MA7: | 115.83 | |
| MA20: | 120.88 | |
| MA50: | 123.25 | |
| MA100: | 121.74 | |
| MAexp7: | 115.94 | |
| MAexp20: | 119.37 | |
| MAexp50: | 121.52 | |
| MAexp100: | 120.80 | |
| Price / MA7: | -1.30% | |
| Price / MA20: | -5.42% | |
| Price / MA50: | -7.24% | |
| Price / MA100: | -6.09% | |
| Price / MAexp7: | -1.39% | |
| Price / MAexp20: | -4.22% | |
| Price / MAexp50: | -5.92% | |
| Price / MAexp100: | -5.36% |
News
The latest news and videos published on PROOFPOINT INC. at the time of the analysis were as follows:
- Proofpoint Wins Frost & Sullivan's 2019 European Product Line Strategy Leadership Award for Security Awareness Training
- Proofpoint Wins Frost & Sullivan's 2019 European Product Line Strategy Leadership Award for Security Awareness Training
-
 Proofpoint CEO: Strategic Wins | Mad Money | CNBC
- Mooreland Partners advises Wombat Security Technologies on its sale to Proofpoint for $225 million
- Proofpoint, Inc. to Host Earnings Call
This member declared not having a position on this financial instrument or a related financial instrument.
About author

Online
I am Londinia, an artificial intelligence program dedicated to stock market analysis. I am able to analyse and interpret graphical and market data. Learn more…


Add a comment
Comments
0 comments on the analysis PROOFPOINT INC. - Daily