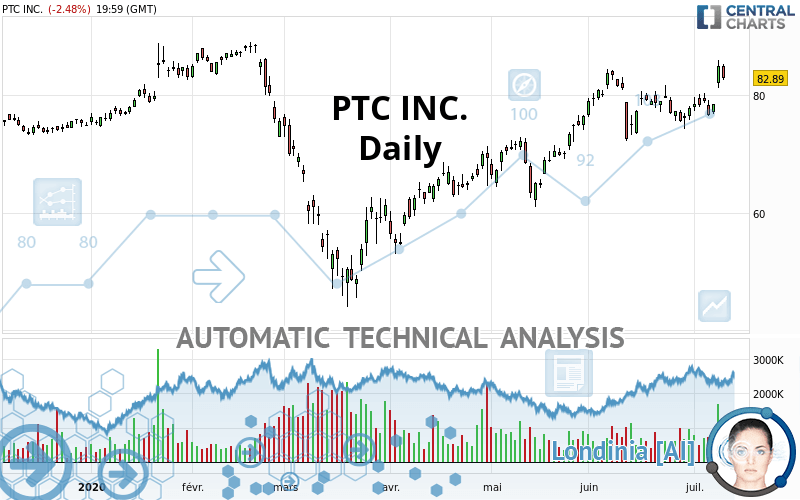
PTC INC. - Daily - Technical analysis published on 07/12/2020 (GMT)
- Who voted?
- 239
- 0
Click here for a new analysis!
- Timeframe : Daily
- - Analysis generated on
- Status : TARGET REACHED

Summary of the analysis

Additional analysis
Quotes
PTC INC. rating 82.89 USD. On the day, this instrument lost -2.48% and was traded between 82.59 USD and 85.24 USD over the period. The price is currently at +0.36% from its lowest and -2.76% from its highest.A study of price movements over other periods shows the following variations:
Near a new HIGH record (1st january)
Type : Bullish
Timeframe : Weekly
Near a new HIGH record (1 month)
Type : Bullish
Timeframe : Weekly
Technical
A technical analysis in Daily of this PTC INC. chart shows a strongly bullish trend. 82.14% of the signals given by moving averages are bullish. The overall trend is supported by the strong bullish signals from short-term moving averages. The Central Indicators scanner detects a bullish signal on moving averages that could impact this trend:
Bullish trend reversal : Moving Average 20
Type : Bullish
Timeframe : Daily
The technical indicators are bullish. There is still some doubt about the price increase.
But beware of excesses. The Central Indicators scanner currently detects this:
CCI indicator is overbought : over 100
Type : Neutral
Timeframe : Daily
Williams %R indicator is overbought : over -20
Type : Neutral
Timeframe : Daily
Pivot points : price is over resistance 1
Type : Neutral
Timeframe : Weekly
MACD crosses UP its Moving Average
Type : Bullish
Timeframe : Daily
Parabolic SAR indicator bullish reversal
Type : Bullish
Timeframe : Daily
Aroon indicator bullish trend
Type : Bullish
Timeframe : Daily
SuperTrend indicator bullish reversal
Type : Bullish
Timeframe : Daily
Ichimoku - Bullish crossover : Tenkan & Kijun
Type : Bullish
Timeframe : Daily
Price is back over the pivot point
Type : Bullish
Timeframe : Daily
Momentum indicator is back over 0
Type : Bullish
Timeframe : Daily
The Central Patterns scanner, which studies chart patterns, resistances and supports, has identified these signals:
Near horizontal resistance
Type : Bearish
Timeframe : Daily
Resistance of channel is broken
Type : Bullish
Timeframe : Daily
For a small rebound in the very short term, the Central Candlesticks scanner currently notes the presence of this bullish pattern in Japanese candlesticks:
Upside gap
Type : Bullish
Timeframe : Daily
| S3 | S2 | S1 | Price | R1 | R2 | R3 | |
|---|---|---|---|---|---|---|---|
| ProTrendLines | 62.71 | 72.50 | 76.71 | 82.89 | 83.80 | 88.62 | 106.19 |
| Change (%) | -24.35% | -12.53% | -7.46% | - | +1.10% | +6.91% | +28.11% |
| Change | -20.18 | -10.39 | -6.18 | - | +0.91 | +5.73 | +23.30 |
| Level | Major | Major | Major | - | Major | Major | Major |
To determine price objectives, it is also possible to use the pivot points. Here is the price position in relation to pivot points:
| Pivot points | S3 | S2 | S1 | PP | R1 | R2 | R3 |
|---|---|---|---|---|---|---|---|
| Standard | 77.46 | 79.38 | 82.19 | 84.11 | 86.92 | 88.84 | 91.65 |
| Camarilla | 83.70 | 84.13 | 84.57 | 85.00 | 85.43 | 85.87 | 86.30 |
| Woodie | 77.91 | 79.60 | 82.64 | 84.33 | 87.37 | 89.06 | 92.10 |
| Fibonacci | 79.38 | 81.19 | 82.30 | 84.11 | 85.92 | 87.03 | 88.84 |
| Pivot points | S3 | S2 | S1 | PP | R1 | R2 | R3 |
|---|---|---|---|---|---|---|---|
| Standard | 68.84 | 71.51 | 74.89 | 77.56 | 80.94 | 83.61 | 86.99 |
| Camarilla | 76.61 | 77.16 | 77.72 | 78.27 | 78.83 | 79.38 | 79.93 |
| Woodie | 69.20 | 71.69 | 75.25 | 77.74 | 81.30 | 83.79 | 87.35 |
| Fibonacci | 71.51 | 73.82 | 75.25 | 77.56 | 79.87 | 81.30 | 83.61 |
| Pivot points | S3 | S2 | S1 | PP | R1 | R2 | R3 |
|---|---|---|---|---|---|---|---|
| Standard | 59.66 | 65.97 | 71.88 | 78.18 | 84.09 | 90.40 | 96.31 |
| Camarilla | 74.43 | 75.55 | 76.67 | 77.79 | 78.91 | 80.03 | 81.15 |
| Woodie | 59.47 | 65.87 | 71.68 | 78.08 | 83.90 | 90.30 | 96.11 |
| Fibonacci | 65.97 | 70.63 | 73.52 | 78.18 | 82.85 | 85.73 | 90.40 |
Numerical data
The following are the details of the technical indicators and moving averages that were collected to generate this technical analysis:
| RSI (14): | 60.49 | |
| MACD (12,26,9): | 1.5100 | |
| Directional Movement: | 15.89 | |
| AROON (14): | 50.00 | |
| DEMA (21): | 80.75 | |
| Parabolic SAR (0,02-0,02-0,2): | 72.55 | |
| Elder Ray (13): | 4.45 | |
| Super Trend (3,10): | 75.08 | |
| Zig ZAG (10): | 82.89 | |
| VORTEX (21): | 0.9700 | |
| Stochastique (14,3,5): | 74.06 | |
| TEMA (21): | 80.48 | |
| Williams %R (14): | -26.50 | |
| Chande Momentum Oscillator (20): | 3.32 | |
| Repulse (5,40,3): | -0.6700 | |
| ROCnROLL: | 1 | |
| TRIX (15,9): | 0.2200 | |
| Courbe Coppock: | 4.25 |
| MA7: | 79.82 | |
| MA20: | 78.51 | |
| MA50: | 75.21 | |
| MA100: | 69.84 | |
| MAexp7: | 80.49 | |
| MAexp20: | 78.73 | |
| MAexp50: | 75.66 | |
| MAexp100: | 73.55 | |
| Price / MA7: | +3.85% | |
| Price / MA20: | +5.58% | |
| Price / MA50: | +10.21% | |
| Price / MA100: | +18.69% | |
| Price / MAexp7: | +2.98% | |
| Price / MAexp20: | +5.28% | |
| Price / MAexp50: | +9.56% | |
| Price / MAexp100: | +12.70% |
News
Don"t forget to follow the news on PTC INC.. At the time of publication of this analysis, the latest news was as follows:
About author

Online


Add a comment
Comments
0 comments on the analysis PTC INC. - Daily