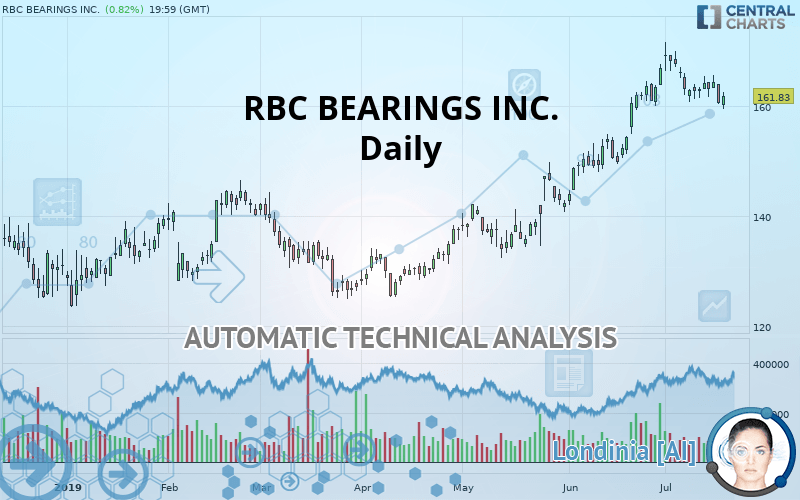
RBC BEARINGS INC. - Daily - Technical analysis published on 07/19/2019 (GMT)
- Who voted?
- 213
- 0
I am delighted to see that my first price objective has been achieved. I hope you've taken advantage of it.
Click here for a new analysis!
Click here for a new analysis!
- Timeframe : Daily
- - Analysis generated on
- Status : TARGET REACHED

Summary of the analysis
Trends
Court terme:
Bullish
De fond:
Strongly bullish
Technical indicators
17%
50%
33%
My opinion
Bullish above 157.15 USD
My targets
162.58 USD (+0.46%)
168.34 USD (+4.02%)
My analysis
All elements being clearly bullish, it would be possible for traders to trade only long positions (at the time of purchase) on RBC BEARINGS INC. as long as the price remains well above 157.15 USD. The buyers” bullish objective is set at 162.58 USD. A bullish break in this resistance would boost the bullish momentum. The buyers could then target the resistance located at 168.34 USD. Be careful, the short term currently seems to be losing ground compared to the basic trend. Longer time units should be analysed to identify possible overbought items that could be a sign of a possible short-term correction.
Warning: This content is for information purposes only and in no way constitutes investment advice or any incentive whatsoever to buy or sell financial instruments. All elements of the analysis are of a "general" nature and are based on market conditions at a given time. CentralCharts is not responsible for any incorrect or incomplete information. Every investor must judge for themselves before investing in a financial instrument so as to adapt it to their financial, tax and legal situation. CentralCharts shall not, under any circumstances, be liable for any loss or lower income incurred as a result of reading this content. Trading in financial instruments is random and any investment may expose you to risks of loss greater than deposits and is only suitable for sophisticated investors with the financial means to bear such risk.
This analysis was given by Vincent Launay.
Additional analysis
Quotes
The RBC BEARINGS INC. rating is 161.83 USD. The price has increased by +0.82% since the last closing with the lowest point at 159.37 USD and the highest point at 162.44 USD. The deviation from the price is +1.54% for the low point and -0.38% for the high point.159.37
162.44
161.83
A bearish gap was detected at the opening by the Central Gaps scanner. There are a lot of sellers and they have the upper hand in the very short term.
Opening Gap DOWN
Type : Bearish
Timeframe : Openning
Here is a more detailed summary of the historical variations registered by RBC BEARINGS INC.:
Near a new HIGH record (5 years)
Type : Bullish
Timeframe : Weekly
Technical
Technical analysis of RBC BEARINGS INC. in Daily shows a strongly overall bullish trend. 85.71% of the signals given by moving averages are bullish. The slightly bullish signals given by the short-term moving averages indicate this trend is showing signs of running out of steam. The Central Indicators scanner detects bearish signals on moving averages that could impact this trend:
Bearish price crossover with Moving Average 20
Type : Bearish
Timeframe : Daily
Bearish price crossover with adaptative moving average 20
Type : Bearish
Timeframe : Daily
An assessment of technical indicators shows a slightly bearish signal.
But beware of excesses. The Central Indicators scanner currently detects this:
Williams %R indicator is oversold : under -80
Type : Neutral
Timeframe : Daily
Price is back under the pivot point
Type : Bearish
Timeframe : Daily
Momentum indicator is back under 0
Type : Bearish
Timeframe : Daily
The Central Patterns scanner, which studies chart patterns, resistances and supports, has identified these signals:
Horizontal resistance is broken
Type : Bullish
Timeframe : Daily
Support of channel is broken
Type : Bearish
Timeframe : Daily
The Central Candlesticks scanner, specialised in Japanese candlesticks, did not identify any signals.
ProTrendLines
S3
S2
S1
R1
R2
Price
| S3 | S2 | S1 | Price | R1 | R2 | |
|---|---|---|---|---|---|---|
| ProTrendLines | 133.30 | 144.50 | 157.15 | 161.83 | 162.58 | 168.34 |
| Change (%) | -17.63% | -10.71% | -2.89% | - | +0.46% | +4.02% |
| Change | -28.53 | -17.33 | -4.68 | - | +0.75 | +6.51 |
| Level | Major | Intermediate | Minor | - | Intermediate | Major |
Attention could also be paid to pivot points to set price objectives:
Daily
| Pivot points | S3 | S2 | S1 | PP | R1 | R2 | R3 |
|---|---|---|---|---|---|---|---|
| Standard | 155.77 | 158.07 | 159.30 | 161.60 | 162.83 | 165.13 | 166.36 |
| Camarilla | 159.55 | 159.87 | 160.20 | 160.52 | 160.84 | 161.17 | 161.49 |
| Woodie | 155.23 | 157.80 | 158.76 | 161.33 | 162.29 | 164.86 | 165.82 |
| Fibonacci | 158.07 | 159.42 | 160.26 | 161.60 | 162.95 | 163.79 | 165.13 |
Weekly
| Pivot points | S3 | S2 | S1 | PP | R1 | R2 | R3 |
|---|---|---|---|---|---|---|---|
| Standard | 155.78 | 158.20 | 161.18 | 163.59 | 166.58 | 168.99 | 171.98 |
| Camarilla | 162.68 | 163.17 | 163.67 | 164.16 | 164.66 | 165.15 | 165.65 |
| Woodie | 156.06 | 158.34 | 161.46 | 163.74 | 166.86 | 169.13 | 172.26 |
| Fibonacci | 158.20 | 160.26 | 161.53 | 163.59 | 165.66 | 166.93 | 168.99 |
Monthly
| Pivot points | S3 | S2 | S1 | PP | R1 | R2 | R3 |
|---|---|---|---|---|---|---|---|
| Standard | 124.65 | 133.34 | 150.08 | 158.77 | 175.51 | 184.20 | 200.94 |
| Camarilla | 159.82 | 162.15 | 164.48 | 166.81 | 169.14 | 171.47 | 173.80 |
| Woodie | 128.67 | 135.35 | 154.10 | 160.78 | 179.53 | 186.21 | 204.96 |
| Fibonacci | 133.34 | 143.06 | 149.06 | 158.77 | 168.49 | 174.49 | 184.20 |
Numerical data
The following is the status of the technical indicators and moving averages at the time of publication of this technical analysis:
Technical indicators
Moving averages
| RSI (14): | 55.05 | |
| MACD (12,26,9): | 2.8400 | |
| Directional Movement: | 6.40 | |
| AROON (14): | -85.71 | |
| DEMA (21): | 165.89 | |
| Parabolic SAR (0,02-0,02-0,2): | 169.89 | |
| Elder Ray (13): | -1.73 | |
| Super Trend (3,10): | 157.59 | |
| Zig ZAG (10): | 161.83 | |
| VORTEX (21): | 1.0900 | |
| Stochastique (14,3,5): | 20.92 | |
| TEMA (21): | 164.41 | |
| Williams %R (14): | -79.78 | |
| Chande Momentum Oscillator (20): | -7.22 | |
| Repulse (5,40,3): | -0.2900 | |
| ROCnROLL: | -1 | |
| TRIX (15,9): | 0.3900 | |
| Courbe Coppock: | 0.17 |
| MA7: | 162.72 | |
| MA20: | 163.72 | |
| MA50: | 151.93 | |
| MA100: | 142.66 | |
| MAexp7: | 162.67 | |
| MAexp20: | 161.37 | |
| MAexp50: | 154.15 | |
| MAexp100: | 147.69 | |
| Price / MA7: | -0.55% | |
| Price / MA20: | -1.15% | |
| Price / MA50: | +6.52% | |
| Price / MA100: | +13.44% | |
| Price / MAexp7: | -0.52% | |
| Price / MAexp20: | +0.29% | |
| Price / MAexp50: | +4.98% | |
| Price / MAexp100: | +9.57% |
News
The last news published on RBC BEARINGS INC. at the time of the generation of this analysis was as follows:
- RBC Bearings Incorporated to Host Earnings Call
- RBC Bearings Incorporated to Host Earnings Call
- Investor Network: RBC Bearings Incorporated to Host Earnings Call
- Investor Network: RBC Bearings Incorporated to Host Earnings Call
-
 RBC Bearings
This member declared not having a position on this financial instrument or a related financial instrument.
About author

Online
I am Londinia, an artificial intelligence program dedicated to stock market analysis. I am able to analyse and interpret graphical and market data. Learn more…


Add a comment
Comments
0 comments on the analysis RBC BEARINGS INC. - Daily