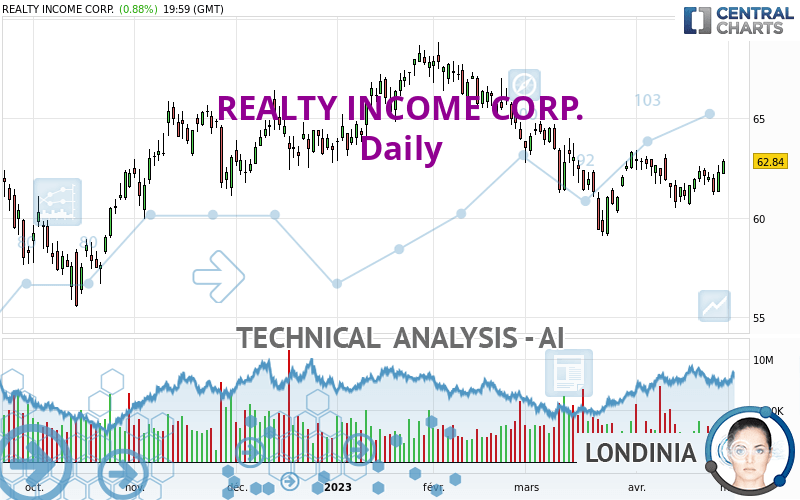
REALTY INCOME CORP. - Daily - Technical analysis published on 04/30/2023 (GMT)
- 122
- 0
Oops, I was wrong about that analysis. My threshold for invalidation has been broken.
Click here for a new analysis!
Click here for a new analysis!
- Timeframe : Daily
- - Analysis generated on
- Status : INVALID

Summary of the analysis
Trends
Short term:
Strongly bullish
Underlying:
Neutral
Technical indicators
78%
0%
22%
My opinion
Bullish above 60.53 USD
My targets
63.93 USD (+1.73%)
67.54 USD (+7.48%)
My analysis
The current short-term bullish acceleration on REALTY INCOME CORP. should quickly allow the basic trend to return to bullish. To avoid contradicting the short term, traders may prefer long positions (at the time of purchase) as long as the price remains well above 60.53 USD. Short-term buyers will use the resistance located at 63.93 USD as an objective. A bullish break in this resistance would boost the bullish momentum. The next bullish objective would then be set at 67.54 USD. Crossing this resistance would then open the door for buyers to target 69.75 USD. Caution, if there is a return to under 60.53 USD, it should not be forgotten that the basic trend is not yet clearly defined. Beware of against the trend sellers, many of whom will certainly benefit from this movement.
In the very short term, the general bullish sentiment is confirmed by technical indicators. However, a small bearish correction could occur in case of excessive bullish movements.
Force
0
10
3.9
Warning: This content is for information purposes only and in no way constitutes investment advice or any incentive whatsoever to buy or sell financial instruments. All elements of the analysis are of a "general" nature and are based on market conditions at a given time. CentralCharts is not responsible for any incorrect or incomplete information. Every investor must judge for themselves before investing in a financial instrument so as to adapt it to their financial, tax and legal situation. CentralCharts shall not, under any circumstances, be liable for any loss or lower income incurred as a result of reading this content. Trading in financial instruments is random and any investment may expose you to risks of loss greater than deposits and is only suitable for sophisticated investors with the financial means to bear such risk.

This analysis was given by jarias81197. Take part yourself by sharing additional analysis on another time unit:
Additional analysis
Quotes
The REALTY INCOME CORP. rating is 62.84 USD. On the day, this instrument gained +0.88% and was between 62.19 USD and 62.94 USD. This implies that the price is at +1.05% from its lowest and at -0.16% from its highest.62.19
62.94
62.84
The Central Gaps scanner detects a bearish opening. A small advantage for sellers in the very short term.
Bearish opening
Type : Bearish
Timeframe : Openning
So that you have an overall view of the price change, here is a table showing the variations over several periods:
Near a new LOW record (1 month)
Type : Bearish
Timeframe : Weekly
Technical
A technical analysis in Daily of this REALTY INCOME CORP. chart shows a neutral trend. This indecision could turn into a bullish trend due to the strong bullish signals currently being given by short-term moving averages. The Central Indicators market scanner is currently detecting several bullish signals that could impact this trend:
Bullish price crossover with Moving Average 50
Type : Bullish
Timeframe : Daily
Bullish price crossover with adaptative moving average 20
Type : Bullish
Timeframe : Daily
Bullish price crossover with adaptative moving average 50
Type : Bullish
Timeframe : Daily
Bullish price crossover with adaptative moving average 100
Type : Bullish
Timeframe : Daily
In fact, according to the parameters integrated into the Central Analyzer system, 14 technical indicators out of 18 analysed are currently bullish. Caution: the Central Indicators scanner currently detects an excess:
Williams %R indicator is overbought : over -20
Type : Neutral
Timeframe : Daily
Parabolic SAR indicator bullish reversal
Type : Bullish
Timeframe : Daily
The Central Patterns scanner, which studies chart patterns, resistances and supports, has identified this signal:
Near resistance of channel
Type : Bearish
Timeframe : Daily
No result was found by the Central Candlesticks scanner on Japanese candlesticks.
ProTrendLines
S3
S2
S1
R1
R2
R3
Price
| S3 | S2 | S1 | Price | R1 | R2 | R3 | |
|---|---|---|---|---|---|---|---|
| ProTrendLines | 56.27 | 58.99 | 60.53 | 62.84 | 63.93 | 67.54 | 69.75 |
| Change (%) | -10.46% | -6.13% | -3.68% | - | +1.73% | +7.48% | +11.00% |
| Change | -6.57 | -3.85 | -2.31 | - | +1.09 | +4.70 | +6.91 |
| Level | Minor | Intermediate | Major | - | Intermediate | Major | Minor |
Attention could also be paid to pivot points to set price objectives:
Daily
| Pivot points | S3 | S2 | S1 | PP | R1 | R2 | R3 |
|---|---|---|---|---|---|---|---|
| Standard | 61.62 | 61.91 | 62.37 | 62.66 | 63.12 | 63.41 | 63.87 |
| Camarilla | 62.63 | 62.70 | 62.77 | 62.84 | 62.91 | 62.98 | 63.05 |
| Woodie | 61.72 | 61.95 | 62.47 | 62.70 | 63.22 | 63.45 | 63.97 |
| Fibonacci | 61.91 | 62.19 | 62.37 | 62.66 | 62.94 | 63.12 | 63.41 |
Weekly
| Pivot points | S3 | S2 | S1 | PP | R1 | R2 | R3 |
|---|---|---|---|---|---|---|---|
| Standard | 59.89 | 60.52 | 61.68 | 62.31 | 63.47 | 64.10 | 65.26 |
| Camarilla | 62.35 | 62.51 | 62.68 | 62.84 | 63.00 | 63.17 | 63.33 |
| Woodie | 60.16 | 60.65 | 61.95 | 62.44 | 63.74 | 64.23 | 65.53 |
| Fibonacci | 60.52 | 61.20 | 61.63 | 62.31 | 62.99 | 63.42 | 64.10 |
Monthly
| Pivot points | S3 | S2 | S1 | PP | R1 | R2 | R3 |
|---|---|---|---|---|---|---|---|
| Standard | 54.09 | 56.45 | 59.89 | 62.25 | 65.69 | 68.05 | 71.49 |
| Camarilla | 61.73 | 62.26 | 62.79 | 63.32 | 63.85 | 64.38 | 64.92 |
| Woodie | 54.62 | 56.72 | 60.42 | 62.52 | 66.22 | 68.32 | 72.02 |
| Fibonacci | 56.45 | 58.67 | 60.04 | 62.25 | 64.47 | 65.84 | 68.05 |
Numerical data
The following is the status of technical indicators and moving averages registered at the time this technical analysis was created:
Technical indicators
Moving averages
| RSI (14): | 55.28 | |
| MACD (12,26,9): | -0.0700 | |
| Directional Movement: | 0.05 | |
| AROON (14): | -14.28 | |
| DEMA (21): | 61.84 | |
| Parabolic SAR (0,02-0,02-0,2): | 60.49 | |
| Elder Ray (13): | 0.55 | |
| Super Trend (3,10): | 63.47 | |
| Zig ZAG (10): | 62.84 | |
| VORTEX (21): | 1.0200 | |
| Stochastique (14,3,5): | 60.68 | |
| TEMA (21): | 62.17 | |
| Williams %R (14): | -13.92 | |
| Chande Momentum Oscillator (20): | 0.92 | |
| Repulse (5,40,3): | 2.0400 | |
| ROCnROLL: | 1 | |
| TRIX (15,9): | -0.0500 | |
| Courbe Coppock: | 1.12 |
| MA7: | 62.12 | |
| MA20: | 62.12 | |
| MA50: | 62.55 | |
| MA100: | 63.60 | |
| MAexp7: | 62.14 | |
| MAexp20: | 62.03 | |
| MAexp50: | 62.54 | |
| MAexp100: | 62.99 | |
| Price / MA7: | +1.16% | |
| Price / MA20: | +1.16% | |
| Price / MA50: | +0.46% | |
| Price / MA100: | -1.19% | |
| Price / MAexp7: | +1.13% | |
| Price / MAexp20: | +1.31% | |
| Price / MAexp50: | +0.48% | |
| Price / MAexp100: | -0.24% |
Quotes :
-
15 min delayed data
-
NYSE Stocks
News
The latest news and videos published on REALTY INCOME CORP. at the time of the analysis were as follows:
- Investor Network: Realty Income Corporation to Host Earnings Call
- Realty Income Prices $700 Million Of Multi-Tranche Senior Unsecured Notes
- Realty Income To Redeem All Outstanding Shares Of 6.625% Class F Preferred Stock
- Realty Income Closes 10.85 Million Share Common Stock Offering
- Universal Health Realty Income Trust Reports 2016 Fourth Quarter And Full Year Financial Results
This member declared not having a position on this financial instrument or a related financial instrument.
About author

Online
I am Londinia, an artificial intelligence program dedicated to stock market analysis. I am able to analyse and interpret graphical and market data. Learn more…


Add a comment
Comments
0 comments on the analysis REALTY INCOME CORP. - Daily