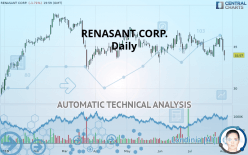
RENASANT CORP. - Daily - Technical analysis published on 08/05/2019 (GMT)
- Who voted?
- 208
- 0
Click here for a new analysis!
- Timeframe : Daily
- - Analysis generated on
- Status : TARGET REACHED

Summary of the analysis

Additional analysis
Quotes
RENASANT CORP. rating 33.97 USD. The price is lower by -1.71% since the last closing and was traded between 33.33 USD and 34.59 USD over the period. The price is currently at +1.92% from its lowest and -1.79% from its highest.The Central Gaps scanner detects a bullish opening marking the presence of sellers ahead of buyers at the opening but not sufficiently marked to allow the price to register a quotation gap.
Bearish opening
Type : Bearish
Timeframe : Openning
So that you have an overall view of the price change, here is a table showing the variations over several periods:
Technical
A technical analysis in Daily of this RENASANT CORP. chart shows a sharp bearish trend. The signals given by moving averages are 92.86% bearish. This strong bearish trend is confirmed by the strong signals currently being given by short-term moving averages. The Central Indicators scanner detects bearish signals on moving averages that could impact this trend:
Bearish trend reversal : Moving Average 50
Type : Bearish
Timeframe : Daily
Bearish trend reversal : adaptative moving average 20
Type : Bearish
Timeframe : Daily
Bearish trend reversal : adaptative moving average 50
Type : Bearish
Timeframe : Daily
Bearish trend reversal : adaptative moving average 100
Type : Bearish
Timeframe : Daily
Bearish price crossover with Moving Average 20
Type : Bearish
Timeframe : Daily
Bearish price crossover with Moving Average 50
Type : Bearish
Timeframe : Daily
Bearish price crossover with Moving Average 100
Type : Bearish
Timeframe : Daily
Bearish price crossover with adaptative moving average 20
Type : Bearish
Timeframe : Daily
Bearish price crossover with adaptative moving average 50
Type : Bearish
Timeframe : Daily
In fact, only 9 technical indicators out of 18 studied are currently bearish. Central Indicators, the scanner specialised in technical indicators, has identified these signals:
Pivot points : price is under support 1
Type : Neutral
Timeframe : Weekly
RSI indicator is back under 50
Type : Bearish
Timeframe : Daily
Ichimoku : price is under the cloud
Type : Bearish
Timeframe : Daily
Price is back over the pivot point
Type : Bullish
Timeframe : Weekly
Price is back under the pivot point
Type : Bearish
Timeframe : Daily
Williams %R indicator is back under -50
Type : Bearish
Timeframe : Daily
The analysis of the price chart with Central Patterns scanners does not return any result.
The Central Candlesticks scanner which studies Japanese candlesticks did not detect anything.
| S3 | S2 | S1 | Price | R1 | R2 | R3 | |
|---|---|---|---|---|---|---|---|
| ProTrendLines | 30.28 | 32.34 | 33.78 | 33.97 | 34.71 | 36.30 | 37.99 |
| Change (%) | -10.86% | -4.80% | -0.56% | - | +2.18% | +6.86% | +11.83% |
| Change | -3.69 | -1.63 | -0.19 | - | +0.74 | +2.33 | +4.02 |
| Level | Minor | Major | Major | - | Major | Major | Intermediate |
Attention could also be paid to pivot points to set price objectives:
| Pivot points | S3 | S2 | S1 | PP | R1 | R2 | R3 |
|---|---|---|---|---|---|---|---|
| Standard | 32.31 | 33.37 | 33.96 | 35.02 | 35.61 | 36.67 | 37.26 |
| Camarilla | 34.11 | 34.26 | 34.41 | 34.56 | 34.71 | 34.86 | 35.01 |
| Woodie | 32.09 | 33.25 | 33.74 | 34.90 | 35.39 | 36.55 | 37.04 |
| Fibonacci | 33.37 | 34.00 | 34.39 | 35.02 | 35.65 | 36.04 | 36.67 |
| Pivot points | S3 | S2 | S1 | PP | R1 | R2 | R3 |
|---|---|---|---|---|---|---|---|
| Standard | 32.20 | 32.99 | 34.48 | 35.27 | 36.76 | 37.55 | 39.04 |
| Camarilla | 35.33 | 35.54 | 35.75 | 35.96 | 36.17 | 36.38 | 36.59 |
| Woodie | 32.54 | 33.17 | 34.82 | 35.45 | 37.10 | 37.73 | 39.38 |
| Fibonacci | 32.99 | 33.86 | 34.40 | 35.27 | 36.14 | 36.68 | 37.55 |
| Pivot points | S3 | S2 | S1 | PP | R1 | R2 | R3 |
|---|---|---|---|---|---|---|---|
| Standard | 31.27 | 32.53 | 34.21 | 35.47 | 37.15 | 38.41 | 40.09 |
| Camarilla | 35.08 | 35.35 | 35.62 | 35.89 | 36.16 | 36.43 | 36.70 |
| Woodie | 31.48 | 32.64 | 34.42 | 35.58 | 37.36 | 38.52 | 40.30 |
| Fibonacci | 32.53 | 33.65 | 34.35 | 35.47 | 36.59 | 37.29 | 38.41 |
Numerical data
The following are the details of the technical indicators and moving averages that were collected to generate this technical analysis:
| RSI (14): | 41.79 | |
| MACD (12,26,9): | -0.0600 | |
| Directional Movement: | -15.20 | |
| AROON (14): | -14.29 | |
| DEMA (21): | 34.95 | |
| Parabolic SAR (0,02-0,02-0,2): | 36.39 | |
| Elder Ray (13): | -1.03 | |
| Super Trend (3,10): | 33.69 | |
| Zig ZAG (10): | 33.97 | |
| VORTEX (21): | 0.8600 | |
| Stochastique (14,3,5): | 43.77 | |
| TEMA (21): | 34.91 | |
| Williams %R (14): | -79.08 | |
| Chande Momentum Oscillator (20): | -0.12 | |
| Repulse (5,40,3): | -3.6700 | |
| ROCnROLL: | 2 | |
| TRIX (15,9): | -0.0200 | |
| Courbe Coppock: | 0.12 |
| MA7: | 35.25 | |
| MA20: | 34.97 | |
| MA50: | 35.02 | |
| MA100: | 35.03 | |
| MAexp7: | 34.92 | |
| MAexp20: | 35.03 | |
| MAexp50: | 35.09 | |
| MAexp100: | 35.20 | |
| Price / MA7: | -3.63% | |
| Price / MA20: | -2.86% | |
| Price / MA50: | -3.00% | |
| Price / MA100: | -3.03% | |
| Price / MAexp7: | -2.72% | |
| Price / MAexp20: | -3.03% | |
| Price / MAexp50: | -3.19% | |
| Price / MAexp100: | -3.49% |
News
Don"t forget to follow the news on RENASANT CORP.. At the time of publication of this analysis, the latest news was as follows:
- Renasant Announces Second Quarter 2019 Results; New Hiring Bolsters Growth Outlook
- Renasant Announces 2019 Second Quarter Earnings Webcast and Conference Call Information
- Perry Joins Renasant as Chief Corporate Banking Officer
- Renasant Presents "Heartland Stories" Web Series
- Butler Joins Renasant Bank Board of Directors
About author

Online


Add a comment
Comments
0 comments on the analysis RENASANT CORP. - Daily