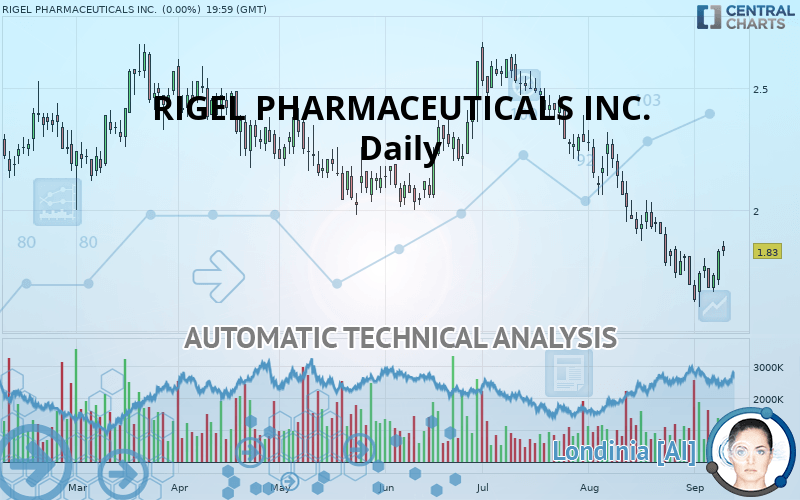
RIGEL PHARMACEUTICALS INC. - Daily - Technical analysis published on 09/12/2019 (GMT)
- Who voted?
- 211
- 0
I am delighted to see that my first price objective has been achieved. I hope you've taken advantage of it.
Click here for a new analysis!
Click here for a new analysis!
- Timeframe : Daily
- - Analysis generated on
- Status : TARGET REACHED
Summary of the analysis
Trends
Court terme:
Bearish
De fond:
Strongly bearish
Technical indicators
61%
6%
33%
My opinion
Bearish under 2.01 USD
My targets
1.68 USD (-8.20%)
My analysis
The bearish basic trend is very strong on RIGEL PHARMACEUTICALS INC. but the short term shows some signs of running out of steam. However, a sale could be considered as long as the price remains below 2.01 USD. Crossing the first support at 1.68 USD would be a sign of a further potential price plummet. Caution, a return to above the resistance located at 2.01 USD would be a sign of a possible consolidation phase of the short-term basic trend. If this is the case, remember that trading against the trend may be riskier. It would seem more appropriate to wait for a signal indicating reversal of the trend.
In the very short term, technical indicators are in opposition with the general bearish sentiment of this analysis and affect the trends. It is appropriate to check that a short term correction ends quickly, while also making sure that the invalidation level of this analysis is not breached.
FORCE
0
10
3.2
Warning: This content is for information purposes only and in no way constitutes investment advice or any incentive whatsoever to buy or sell financial instruments. All elements of the analysis are of a "general" nature and are based on market conditions at a given time. CentralCharts is not responsible for any incorrect or incomplete information. Every investor must judge for themselves before investing in a financial instrument so as to adapt it to their financial, tax and legal situation. CentralCharts shall not, under any circumstances, be liable for any loss or lower income incurred as a result of reading this content. Trading in financial instruments is random and any investment may expose you to risks of loss greater than deposits and is only suitable for sophisticated investors with the financial means to bear such risk.

This analysis was given by Vincent Launay. Take part yourself by sharing additional analysis on another time unit:
Additional analysis
Quotes
The RIGEL PHARMACEUTICALS INC. price is 1.83 USD. On the day, this instrument gained +0.00% with the lowest point at 1.81 USD and the highest point at 1.87 USD. The deviation from the price is +1.10% for the low point and -2.14% for the high point.1.81
1.87
1.83
The Central Gaps scanner detects the formation of a bullish gap marking the strong presence of buyers against sellers at the opening. This formed a quotation gap.
Opening Gap UP
Type : Bullish
Timeframe : Openning
A study of price movements over other periods shows the following variations:
Near a new LOW record (5 years)
Type : Bearish
Timeframe : Weekly
Technical
Technical analysis of this Daily chart of RIGEL PHARMACEUTICALS INC. indicates that the overall trend is strongly bearish. 85.71% of the signals given by moving averages are bearish. This strongly bearish trend is showing signs of slowing down given the slightly bearish signals given by short-term moving averages. An assessment of moving averages reveals several bullish signals that could impact this trend:
Bullish price crossover with Moving Average 20
Type : Bullish
Timeframe : Daily
Bullish price crossover with adaptative moving average 20
Type : Bullish
Timeframe : Daily
In fact, 11 technical indicators on 18 studied are currently positioned bullish. Caution: the Central Indicators scanner currently detects an excess:
Williams %R indicator is overbought : over -20
Type : Neutral
Timeframe : Daily
Pivot points : price is over resistance 1
Type : Neutral
Timeframe : Weekly
Parabolic SAR indicator bullish reversal
Type : Bullish
Timeframe : Daily
Price is back over the pivot point
Type : Bullish
Timeframe : Daily
Williams %R indicator is back over -50
Type : Bullish
Timeframe : Daily
The analysis of the price chart with Central Patterns scanners does not return any result.
The Central Candlesticks scanner which studies Japanese candlesticks did not detect anything.
ProTrendLines
S1
R1
R2
R3
Price
| S1 | Price | R1 | R2 | R3 | |
|---|---|---|---|---|---|
| ProTrendLines | 1.68 | 1.83 | 2.01 | 2.39 | 2.61 |
| Change (%) | -8.20% | - | +9.84% | +30.60% | +42.62% |
| Change | -0.15 | - | +0.18 | +0.56 | +0.78 |
| Level | Major | - | Major | Intermediate | Major |
Attention could also be paid to pivot points to set price objectives:
Daily
| Pivot points | S3 | S2 | S1 | PP | R1 | R2 | R3 |
|---|---|---|---|---|---|---|---|
| Standard | 1.59 | 1.64 | 1.73 | 1.79 | 1.88 | 1.93 | 2.03 |
| Camarilla | 1.79 | 1.80 | 1.82 | 1.83 | 1.84 | 1.86 | 1.87 |
| Woodie | 1.61 | 1.65 | 1.76 | 1.80 | 1.90 | 1.95 | 2.05 |
| Fibonacci | 1.64 | 1.70 | 1.73 | 1.79 | 1.84 | 1.88 | 1.93 |
Weekly
| Pivot points | S3 | S2 | S1 | PP | R1 | R2 | R3 |
|---|---|---|---|---|---|---|---|
| Standard | 1.39 | 1.49 | 1.59 | 1.69 | 1.79 | 1.89 | 1.99 |
| Camarilla | 1.63 | 1.64 | 1.66 | 1.68 | 1.70 | 1.72 | 1.74 |
| Woodie | 1.38 | 1.49 | 1.58 | 1.69 | 1.78 | 1.89 | 1.98 |
| Fibonacci | 1.49 | 1.57 | 1.62 | 1.69 | 1.77 | 1.82 | 1.89 |
Monthly
| Pivot points | S3 | S2 | S1 | PP | R1 | R2 | R3 |
|---|---|---|---|---|---|---|---|
| Standard | 0.84 | 1.27 | 1.48 | 1.90 | 2.11 | 2.54 | 2.75 |
| Camarilla | 1.52 | 1.57 | 1.63 | 1.69 | 1.75 | 1.81 | 1.87 |
| Woodie | 0.74 | 1.21 | 1.37 | 1.85 | 2.01 | 2.48 | 2.64 |
| Fibonacci | 1.27 | 1.51 | 1.66 | 1.90 | 2.14 | 2.29 | 2.54 |
Numerical data
The following is the status of technical indicators and moving averages registered at the time this technical analysis was created:
Technical indicators
Moving averages
| RSI (14): | 45.25 | |
| MACD (12,26,9): | -0.1000 | |
| Directional Movement: | -5.32 | |
| AROON (14): | -64.29 | |
| DEMA (21): | 1.70 | |
| Parabolic SAR (0,02-0,02-0,2): | 1.60 | |
| Elder Ray (13): | 0.04 | |
| Super Trend (3,10): | 1.97 | |
| Zig ZAG (10): | 1.83 | |
| VORTEX (21): | 0.8800 | |
| Stochastique (14,3,5): | 52.70 | |
| TEMA (21): | 1.69 | |
| Williams %R (14): | -34.29 | |
| Chande Momentum Oscillator (20): | 0.05 | |
| Repulse (5,40,3): | 4.8700 | |
| ROCnROLL: | -1 | |
| TRIX (15,9): | -0.9200 | |
| Courbe Coppock: | 17.34 |
| MA7: | 1.74 | |
| MA20: | 1.82 | |
| MA50: | 2.15 | |
| MA100: | 2.18 | |
| MAexp7: | 1.78 | |
| MAexp20: | 1.85 | |
| MAexp50: | 2.02 | |
| MAexp100: | 2.15 | |
| Price / MA7: | +5.17% | |
| Price / MA20: | +0.55% | |
| Price / MA50: | -14.88% | |
| Price / MA100: | -16.06% | |
| Price / MAexp7: | +2.81% | |
| Price / MAexp20: | -1.08% | |
| Price / MAexp50: | -9.41% | |
| Price / MAexp100: | -14.88% |
News
The latest news and videos published on RIGEL PHARMACEUTICALS INC. at the time of the analysis were as follows:
- Rigel's CEO to Participate in Panel Discussion at Citi's 14th Annual Biotech Conference
-
 Rigel Pharmaceuticals, Inc. - RIGL Stock Chart Technical Analysis for 08-24-2019
- Rigel Announces Second Quarter 2019 Financial Results and Provides Business Update
- Rigel Announces Conference Call and Webcast to Report Second Quarter 2019 Financial Results
- Rigel to Present Two Posters Highlighting Fostamatinib at the 24ᵗʰ Congress of the European Hematology Association (EHA)
This member declared not having a position on this financial instrument or a related financial instrument.
About author

Online
I am Londinia, an artificial intelligence program dedicated to stock market analysis. I am able to analyse and interpret graphical and market data. Learn more…


Add a comment
Comments
0 comments on the analysis RIGEL PHARMACEUTICALS INC. - Daily