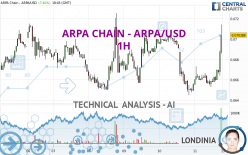
ARPA CHAIN - ARPA/USD - 1H - Technical analysis published on 05/11/2024 (GMT)
- 125
- 0
Click here for a new analysis!
- Timeframe : 1H
- - Analysis generated on
- Status : TARGET REACHED

Summary of the analysis

Additional analysis
Quotes
The ARPA CHAIN - ARPA/USD price is 0.070388 USD. On the day, this instrument gained +7.40% and was traded between 0.065283 USD and 0.071428 USD over the period. The price is currently at +7.82% from its lowest and -1.46% from its highest.The Central Gaps scanner detects a bearish opening marking the presence of sellers ahead of buyers at the opening but not sufficiently marked to allow the price to register a quotation gap.
Bearish opening
Type : Bearish
Timeframe : Openning
A study of price movements over other periods shows the following variations:
Technical
A technical analysis in 1H of this ARPA CHAIN - ARPA/USD chart shows a slightly bullish trend. 57.14% of the signals given by moving averages are bullish. This slightly bullish trend could be reinforced by the strong bullish signals given by short-term moving averages. The Central Indicators scanner detects bullish signals on moving averages that could impact this trend:
Bullish trend reversal : adaptative moving average 50
Type : Bullish
Timeframe : 1 hour
Bullish trend reversal : adaptative moving average 100
Type : Bullish
Timeframe : 1 hour
Technical indicators are strongly bullish, suggesting that the price increase should continue.
Caution: the Central Indicators scanner currently detects an excess:
RSI indicator is overbought : over 70
Type : Neutral
Timeframe : 1 hour
CCI indicator is overbought : over 100
Type : Neutral
Timeframe : 1 hour
Previous candle closed over Bollinger bands
Type : Neutral
Timeframe : 1 hour
Williams %R indicator is overbought : over -20
Type : Neutral
Timeframe : 1 hour
Pivot points : price is over resistance 1
Type : Neutral
Timeframe : 1 hour
Ichimoku : price is over the cloud
Type : Bullish
Timeframe : 1 hour
MACD indicator is back over 0
Type : Bullish
Timeframe : 1 hour
No signals are given by Central Patterns, a market scanner specialised in chart patterns, resistances and supports.
For a small rebound in the very short term, the Central Candlesticks scanner currently notes the presence of this bullish pattern in Japanese candlesticks:
Long white line
Type : Bullish
Timeframe : 1 hour
| S3 | S2 | S1 | Price | R1 | R2 | R3 | |
|---|---|---|---|---|---|---|---|
| ProTrendLines | 0.065694 | 0.068018 | 0.069458 | 0.070388 | 0.072907 | 0.085801 | 0.094120 |
| Change (%) | -6.67% | -3.37% | -1.32% | - | +3.58% | +21.90% | +33.72% |
| Change | -0.004694 | -0.002370 | -0.000930 | - | +0.002519 | +0.015413 | +0.023732 |
| Level | Minor | Intermediate | Intermediate | - | Major | Minor | Minor |
Attention could also be paid to pivot points to set price objectives:
| Pivot points | S3 | S2 | S1 | PP | R1 | R2 | R3 |
|---|---|---|---|---|---|---|---|
| Standard | 0.057299 | 0.060892 | 0.063216 | 0.066809 | 0.069133 | 0.072726 | 0.075050 |
| Camarilla | 0.063913 | 0.064455 | 0.064998 | 0.065540 | 0.066082 | 0.066625 | 0.067167 |
| Woodie | 0.056665 | 0.060575 | 0.062582 | 0.066492 | 0.068499 | 0.072409 | 0.074416 |
| Fibonacci | 0.060892 | 0.063152 | 0.064549 | 0.066809 | 0.069069 | 0.070466 | 0.072726 |
| Pivot points | S3 | S2 | S1 | PP | R1 | R2 | R3 |
|---|---|---|---|---|---|---|---|
| Standard | 0.046766 | 0.052703 | 0.060502 | 0.066439 | 0.074238 | 0.080175 | 0.087974 |
| Camarilla | 0.064525 | 0.065784 | 0.067043 | 0.068302 | 0.069561 | 0.070820 | 0.072079 |
| Woodie | 0.047698 | 0.053169 | 0.061434 | 0.066905 | 0.075170 | 0.080641 | 0.088906 |
| Fibonacci | 0.052703 | 0.057950 | 0.061192 | 0.066439 | 0.071686 | 0.074928 | 0.080175 |
| Pivot points | S3 | S2 | S1 | PP | R1 | R2 | R3 |
|---|---|---|---|---|---|---|---|
| Standard | 0.002079 | 0.031645 | 0.047692 | 0.077258 | 0.093305 | 0.122871 | 0.138918 |
| Camarilla | 0.051195 | 0.055377 | 0.059558 | 0.063739 | 0.067920 | 0.072101 | 0.076283 |
| Woodie | -0.004681 | 0.028265 | 0.040933 | 0.073878 | 0.086546 | 0.119491 | 0.132159 |
| Fibonacci | 0.031645 | 0.049069 | 0.059834 | 0.077258 | 0.094682 | 0.105447 | 0.122871 |
Numerical data
The following are the details of the technical indicators and moving averages that were collected to generate this technical analysis:
| RSI (14): | 65.76 | |
| MACD (12,26,9): | 0.0001 | |
| Directional Movement: | 22.523797 | |
| AROON (14): | 42.857143 | |
| DEMA (21): | 0.066716 | |
| Parabolic SAR (0,02-0,02-0,2): | 0.065409 | |
| Elder Ray (13): | 0.001741 | |
| Super Trend (3,10): | 0.066521 | |
| Zig ZAG (10): | 0.068684 | |
| VORTEX (21): | 1.2798 | |
| Stochastique (14,3,5): | 92.88 | |
| TEMA (21): | 0.067307 | |
| Williams %R (14): | -0.33 | |
| Chande Momentum Oscillator (20): | 0.002852 | |
| Repulse (5,40,3): | 3.9485 | |
| ROCnROLL: | 1 | |
| TRIX (15,9): | -0.0674 | |
| Courbe Coppock: | 3.92 |
| MA7: | 0.068197 | |
| MA20: | 0.069019 | |
| MA50: | 0.079711 | |
| MA100: | 0.074962 | |
| MAexp7: | 0.067706 | |
| MAexp20: | 0.066770 | |
| MAexp50: | 0.067118 | |
| MAexp100: | 0.067366 | |
| Price / MA7: | +3.21% | |
| Price / MA20: | +1.98% | |
| Price / MA50: | -11.70% | |
| Price / MA100: | -6.10% | |
| Price / MAexp7: | +3.96% | |
| Price / MAexp20: | +5.42% | |
| Price / MAexp50: | +4.87% | |
| Price / MAexp100: | +4.49% |
About author
Online


Add a comment
Comments
0 comments on the analysis ARPA CHAIN - ARPA/USD - 1H