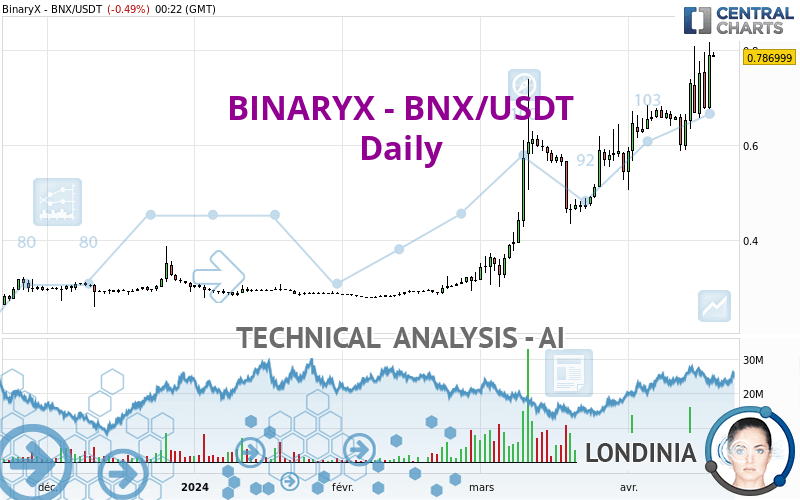
BINARYX - BNX/USDT - Daily - Technical analysis published on 04/19/2024 (GMT)
- 91
- 0
Click here for a new analysis!
- Timeframe : Daily
- - Analysis generated on
- Status : TARGET REACHED

Summary of the analysis

Additional analysis
Quotes
BINARYX - BNX/USDT rating 0.786999 USDT. The price is lower by -0.49% since the last closing with the lowest point at 0.785583 USDT and the highest point at 0.795895 USDT. The deviation from the price is +0.18% for the low point and -1.12% for the high point.The Central Gaps scanner detects a bearish opening. A small advantage for sellers in the very short term.
Bearish opening
Type : Bearish
Timeframe : Openning
Here is a more detailed summary of the historical variations registered by BINARYX - BNX/USDT:
Near a new HIGH record (1 year)
Type : Bullish
Timeframe : Weekly
Near a new HIGH record (1st january)
Type : Bullish
Timeframe : Weekly
Near a new HIGH record (1 month)
Type : Bullish
Timeframe : Weekly
Abnormal volumes on BINARYX - BNX/USDT were detected by the Central Volumes scanner:
Abnormal volumes
Timeframe : 20 days
Abnormal volumes
Timeframe : 50 days
Technical
Technical analysis of BINARYX - BNX/USDT in Daily shows a strongly overall bullish trend. 92.86% of the signals given by moving averages are bullish. The overall trend is supported by the strong bullish signals from short-term moving averages. The Central Indicators market scanner currently does not detect any result that concerns moving averages.
The probability of a further increase is high given the direction of the technical indicators.
Caution: the Central Indicators scanner currently detects an excess:
CCI indicator is overbought : over 100
Type : Neutral
Timeframe : Daily
Previous candle closed over Bollinger bands
Type : Neutral
Timeframe : Daily
Williams %R indicator is overbought : over -20
Type : Neutral
Timeframe : Daily
Pivot points : price is over resistance 2
Type : Neutral
Timeframe : Weekly
The Central Patterns scanner, which studies chart patterns, resistances and supports, has identified this signal:
Resistance of channel is broken
Type : Bullish
Timeframe : Daily
The presence of these Japanese chandelier patterns detected by Central Candlesticks that could impact the current short-term trend were also noted:
Bearish harami
Type : Bearish
Timeframe : Daily
Doji
Type : Neutral
Timeframe : Daily
Bearish harami cross
Type : Bearish
Timeframe : Daily
| S3 | S2 | S1 | Price | |
|---|---|---|---|---|
| ProTrendLines | 0.350458 | 0.465392 | 0.673199 | 0.786999 |
| Change (%) | -55.47% | -40.86% | -14.46% | - |
| Change | -0.436541 | -0.321607 | -0.113800 | - |
| Level | Minor | Minor | Major | - |
To determine price objectives, it is also possible to use the pivot points. Here is the price position in relation to pivot points:
| Pivot points | S3 | S2 | S1 | PP | R1 | R2 | R3 |
|---|---|---|---|---|---|---|---|
| Standard | 0.565286 | 0.621109 | 0.706002 | 0.761825 | 0.846718 | 0.902541 | 0.987434 |
| Camarilla | 0.752198 | 0.765097 | 0.777996 | 0.790895 | 0.803794 | 0.816693 | 0.829592 |
| Woodie | 0.579821 | 0.628377 | 0.720537 | 0.769093 | 0.861253 | 0.909809 | 1.001969 |
| Fibonacci | 0.621109 | 0.674863 | 0.708072 | 0.761825 | 0.815579 | 0.848788 | 0.902541 |
| Pivot points | S3 | S2 | S1 | PP | R1 | R2 | R3 |
|---|---|---|---|---|---|---|---|
| Standard | 0.505473 | 0.546578 | 0.600033 | 0.641138 | 0.694593 | 0.735698 | 0.789153 |
| Camarilla | 0.627484 | 0.636152 | 0.644820 | 0.653488 | 0.662156 | 0.670824 | 0.679492 |
| Woodie | 0.511648 | 0.549666 | 0.606208 | 0.644226 | 0.700768 | 0.738786 | 0.795328 |
| Fibonacci | 0.546578 | 0.582700 | 0.605016 | 0.641138 | 0.677260 | 0.699576 | 0.735698 |
| Pivot points | S3 | S2 | S1 | PP | R1 | R2 | R3 |
|---|---|---|---|---|---|---|---|
| Standard | -0.121193 | 0.089943 | 0.316624 | 0.527760 | 0.754441 | 0.965577 | 1.192258 |
| Camarilla | 0.422905 | 0.463039 | 0.503172 | 0.543305 | 0.583438 | 0.623572 | 0.663705 |
| Woodie | -0.113421 | 0.093829 | 0.324397 | 0.531646 | 0.762214 | 0.969463 | 1.200031 |
| Fibonacci | 0.089943 | 0.257189 | 0.360514 | 0.527760 | 0.695006 | 0.798331 | 0.965577 |
Numerical data
The following are the details of the technical indicators and moving averages that were collected to generate this technical analysis:
| RSI (14): | 64.29 | |
| MACD (12,26,9): | 0.0554 | |
| Directional Movement: | 14.965161 | |
| AROON (14): | 42.857143 | |
| DEMA (21): | 0.741858 | |
| Parabolic SAR (0,02-0,02-0,2): | 0.661317 | |
| Elder Ray (13): | 0.091677 | |
| Super Trend (3,10): | 0.573025 | |
| Zig ZAG (10): | 0.791396 | |
| VORTEX (21): | 1.1561 | |
| Stochastique (14,3,5): | 72.34 | |
| TEMA (21): | 0.752359 | |
| Williams %R (14): | -12.37 | |
| Chande Momentum Oscillator (20): | 0.116012 | |
| Repulse (5,40,3): | 4.8547 | |
| ROCnROLL: | 1 | |
| TRIX (15,9): | 1.1906 | |
| Courbe Coppock: | 29.51 |
| MA7: | 0.723424 | |
| MA20: | 0.656434 | |
| MA50: | 0.563843 | |
| MA100: | 0.427746 | |
| MAexp7: | 0.731314 | |
| MAexp20: | 0.670900 | |
| MAexp50: | 0.574646 | |
| MAexp100: | 0.480019 | |
| Price / MA7: | +8.79% | |
| Price / MA20: | +19.89% | |
| Price / MA50: | +39.58% | |
| Price / MA100: | +83.99% | |
| Price / MAexp7: | +7.61% | |
| Price / MAexp20: | +17.30% | |
| Price / MAexp50: | +36.95% | |
| Price / MAexp100: | +63.95% |
About author

Online


Add a comment
Comments
0 comments on the analysis BINARYX - BNX/USDT - Daily