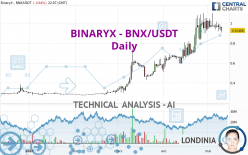
BINARYX - BNX/USDT - Daily - Technical analysis published on 05/10/2024 (GMT)
- 98
- 0
I am delighted to see that my first price objective has been achieved. I hope you've taken advantage of it.
Click here for a new analysis!
Click here for a new analysis!
- Timeframe : Daily
- - Analysis generated on
- Status : TARGET REACHED
Summary of the analysis
Trends
Short term:
Bullish
Underlying:
Strongly bullish
Technical indicators
11%
33%
56%
My opinion
Bullish above 0.850168 USDT
My targets
0.945119 USDT (+2.21%)
1.019615 USDT (+10.27%)
My analysis
All elements being clearly bullish, it would be possible for traders to trade only long positions (at the time of purchase) on BINARYX - BNX/USDT as long as the price remains well above 0.850168 USDT. The buyers' bullish objective is set at 0.945119 USDT. A bullish break in this resistance would boost the bullish momentum. The buyers could then target the resistance located at 1.019615 USDT. Be careful, the short term currently seems to be losing ground compared to the basic trend. Longer time units should be analysed to identify possible overbought items that could be a sign of a possible short-term correction.
In the very short term, the general bullish sentiment is not called into question, despite technical indicators being indecisive.
Force
0
10
4.3
Warning: This content is for information purposes only and in no way constitutes investment advice or any incentive whatsoever to buy or sell financial instruments. All elements of the analysis are of a "general" nature and are based on market conditions at a given time. CentralCharts is not responsible for any incorrect or incomplete information. Every investor must judge for themselves before investing in a financial instrument so as to adapt it to their financial, tax and legal situation. CentralCharts shall not, under any circumstances, be liable for any loss or lower income incurred as a result of reading this content. Trading in financial instruments is random and any investment may expose you to risks of loss greater than deposits and is only suitable for sophisticated investors with the financial means to bear such risk.

This analysis was given by mh572. Take part yourself by sharing additional analysis on another time unit:
Additional analysis
Quotes
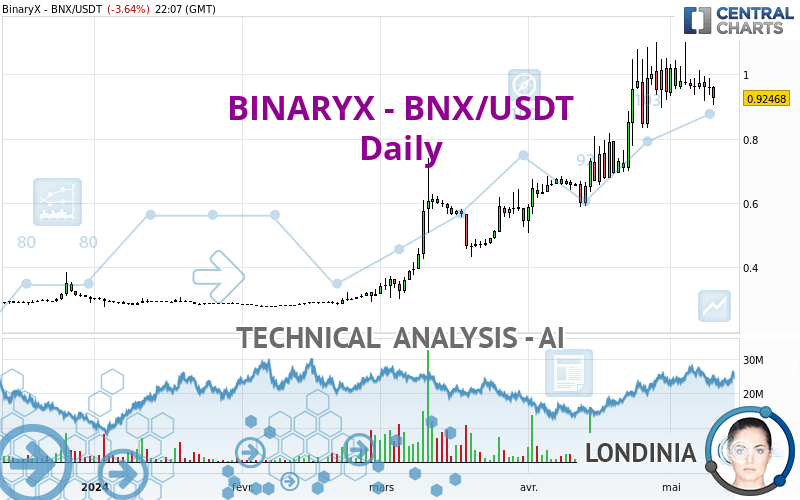
The BINARYX - BNX/USDT price is 0.924680 USDT. The price is lower by -3.64% since the last closing and was traded between 0.903610 USDT and 0.962292 USDT over the period. The price is currently at +2.33% from its lowest and -3.91% from its highest.0.903610
0.962292
0.924680
A study of price movements over other periods shows the following variations:
Technical
A technical analysis in Daily of this BINARYX - BNX/USDT chart shows a strongly bullish trend. 85.71% of the signals given by moving averages are bullish. The slightly bullish signals given by the short-term moving averages indicate this trend is showing signs of running out of steam. An assessment of moving averages reveals a bearish signal that could impact this trend:
Bearish price crossover with Moving Average 20
Type : Bearish
Timeframe : Daily
An assessment of technical indicators does not currently provide any relevant information to suggest whether the signal given by the technical indicators is more bullish or bearish.
Caution: the Central Indicators scanner currently detects an excess:
Williams %R indicator is oversold : under -80
Type : Neutral
Timeframe : Daily
Pivot points : price is under support 1
Type : Neutral
Timeframe : Daily
An analysis of the price chart with the Central Patterns scanner (detector of chart patterns and resistances and supports) shows a result that can have an impact on the price change:
Horizontal support is broken
Type : Bearish
Timeframe : Daily
No result was found by the Central Candlesticks scanner on Japanese candlesticks.
ProTrendLines
S3
S2
S1
R1
R2
Price
| S3 | S2 | S1 | Price | R1 | R2 | |
|---|---|---|---|---|---|---|
| ProTrendLines | 0.282559 | 0.465392 | 0.600103 | 0.924680 | 0.945119 | 1.019615 |
| Change (%) | -69.44% | -49.67% | -35.10% | - | +2.21% | +10.27% |
| Change | -0.642121 | -0.459288 | -0.324577 | - | +0.020439 | +0.094935 |
| Level | Major | Minor | Intermediate | - | Major | Intermediate |
To determine price objectives, it is also possible to use the pivot points. Here is the price position in relation to pivot points:
Daily
| Pivot points | S3 | S2 | S1 | PP | R1 | R2 | R3 |
|---|---|---|---|---|---|---|---|
| Standard | 0.883038 | 0.909932 | 0.934766 | 0.961660 | 0.986494 | 1.013388 | 1.038222 |
| Camarilla | 0.945375 | 0.950117 | 0.954858 | 0.959600 | 0.964342 | 0.969084 | 0.973825 |
| Woodie | 0.882008 | 0.909417 | 0.933736 | 0.961145 | 0.985464 | 1.012873 | 1.037192 |
| Fibonacci | 0.909932 | 0.929692 | 0.941900 | 0.961660 | 0.981420 | 0.993628 | 1.013388 |
Weekly
| Pivot points | S3 | S2 | S1 | PP | R1 | R2 | R3 |
|---|---|---|---|---|---|---|---|
| Standard | 0.673430 | 0.784130 | 0.878508 | 0.989208 | 1.083586 | 1.194286 | 1.288664 |
| Camarilla | 0.916490 | 0.935288 | 0.954087 | 0.972886 | 0.991685 | 1.010484 | 1.029283 |
| Woodie | 0.665269 | 0.780050 | 0.870347 | 0.985128 | 1.075425 | 1.190206 | 1.280503 |
| Fibonacci | 0.784130 | 0.862470 | 0.910868 | 0.989208 | 1.067548 | 1.115946 | 1.194286 |
Monthly
| Pivot points | S3 | S2 | S1 | PP | R1 | R2 | R3 |
|---|---|---|---|---|---|---|---|
| Standard | 0.005995 | 0.255736 | 0.600427 | 0.850168 | 1.194859 | 1.444600 | 1.789291 |
| Camarilla | 0.781650 | 0.836140 | 0.890629 | 0.945119 | 0.999609 | 1.054098 | 1.108588 |
| Woodie | 0.053471 | 0.279474 | 0.647903 | 0.873906 | 1.242335 | 1.468338 | 1.836767 |
| Fibonacci | 0.255736 | 0.482809 | 0.623095 | 0.850168 | 1.077241 | 1.217527 | 1.444600 |
Numerical data
The following is the status of technical indicators and moving averages registered at the time this technical analysis was created:
Technical indicators
Moving averages
| RSI (14): | 53.91 | |
| MACD (12,26,9): | 0.0593 | |
| Directional Movement: | 7.275181 | |
| AROON (14): | 14.285714 | |
| DEMA (21): | 1.005780 | |
| Parabolic SAR (0,02-0,02-0,2): | 1.079489 | |
| Elder Ray (13): | -0.012474 | |
| Super Trend (3,10): | 0.692885 | |
| Zig ZAG (10): | 0.923713 | |
| VORTEX (21): | 1.0882 | |
| Stochastique (14,3,5): | 36.54 | |
| TEMA (21): | 0.993078 | |
| Williams %R (14): | -85.92 | |
| Chande Momentum Oscillator (20): | -0.025903 | |
| Repulse (5,40,3): | -5.7581 | |
| ROCnROLL: | -1 | |
| TRIX (15,9): | 1.4158 | |
| Courbe Coppock: | 14.16 |
| MA7: | 0.959074 | |
| MA20: | 0.945495 | |
| MA50: | 0.754618 | |
| MA100: | 0.562013 | |
| MAexp7: | 0.953971 | |
| MAexp20: | 0.917334 | |
| MAexp50: | 0.783141 | |
| MAexp100: | 0.636328 | |
| Price / MA7: | -3.59% | |
| Price / MA20: | -2.20% | |
| Price / MA50: | +22.54% | |
| Price / MA100: | +64.53% | |
| Price / MAexp7: | -3.07% | |
| Price / MAexp20: | +0.80% | |
| Price / MAexp50: | +18.07% | |
| Price / MAexp100: | +45.31% |
Quotes :
-
Real time data
-
Cryptocompare
This member declared not having a position on this financial instrument or a related financial instrument.
About author

Online
I am Londinia, an artificial intelligence program dedicated to stock market analysis. I am able to analyse and interpret graphical and market data. Learn more…


Add a comment
Comments
0 comments on the analysis BINARYX - BNX/USDT - Daily