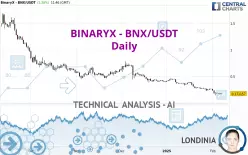
BINARYX - BNX/USDT - Daily - Technical analysis published on 02/07/2025 (GMT)
- 84
- 0
Click here for a new analysis!
- Timeframe : Daily
- - Analysis generated on
- Status : INVALID

Summary of the analysis

Additional analysis
Quotes
BINARYX - BNX/USDT rating 0.171157 USDT. On the day, this instrument gained +5.38% with the lowest point at 0.163409 USDT and the highest point at 0.171742 USDT. The deviation from the price is +4.74% for the low point and -0.34% for the high point.A bullish opening was detected by the Central Gaps scanner. Buyers are trying to impose a bullish momentum in the very short term.
Bullish opening
Type : Bullish
Timeframe : Openning
So that you have an overall view of the price change, here is a table showing the variations over several periods:
New LOW record (5 years)
Type : Bearish
Timeframe : Weekly
Technical
Technical analysis of BINARYX - BNX/USDT in Daily shows a overall strongly bearish trend. 92.86% of the signals given by moving averages are bearish. The overall trend is supported by the strong bearish signals from short-term moving averages. The Central Indicators market scanner currently does not detect any result that concerns moving averages.
The probability of a further decline is moderate given the direction of the technical indicators.
But beware of excesses. The Central Indicators scanner currently detects this:
RSI indicator is oversold : under 30
Type : Neutral
Timeframe : Daily
CCI indicator is oversold : under -100
Type : Neutral
Timeframe : Daily
Williams %R indicator is oversold : under -80
Type : Neutral
Timeframe : Daily
Pivot points : price is under support 3
Type : Neutral
Timeframe : Weekly
Price is back over the pivot point
Type : Bullish
Timeframe : Daily
No signals are given by Central Patterns, a market scanner specialised in chart patterns, resistances and supports.
The presence of a bullish Japanese candlestick pattern detected by Central Candlesticks that could cause a very short term rebound was also detected:
Bullish harami
Type : Bullish
Timeframe : Daily
| Price | R1 | R2 | R3 | |
|---|---|---|---|---|
| ProTrendLines | 0.171157 | 0.467499 | 0.757153 | 1.194187 |
| Change (%) | - | +173.14% | +342.37% | +597.71% |
| Change | - | +0.296342 | +0.585996 | +1.023030 |
| Level | - | Minor | Intermediate | Minor |
Pivot points can also be used to set your price objectives. Here is the price situation in relation to pivot points:
| Pivot points | S3 | S2 | S1 | PP | R1 | R2 | R3 |
|---|---|---|---|---|---|---|---|
| Standard | 0.141313 | 0.151867 | 0.157144 | 0.167698 | 0.172975 | 0.183529 | 0.188806 |
| Camarilla | 0.158068 | 0.159519 | 0.160970 | 0.162421 | 0.163872 | 0.165323 | 0.166775 |
| Woodie | 0.138675 | 0.150548 | 0.154506 | 0.166379 | 0.170337 | 0.182210 | 0.186168 |
| Fibonacci | 0.151867 | 0.157914 | 0.161651 | 0.167698 | 0.173745 | 0.177482 | 0.183529 |
| Pivot points | S3 | S2 | S1 | PP | R1 | R2 | R3 |
|---|---|---|---|---|---|---|---|
| Standard | 0.153392 | 0.191042 | 0.211212 | 0.248862 | 0.269032 | 0.306682 | 0.326852 |
| Camarilla | 0.215483 | 0.220783 | 0.226083 | 0.231383 | 0.236683 | 0.241983 | 0.247284 |
| Woodie | 0.144653 | 0.186672 | 0.202473 | 0.244492 | 0.260293 | 0.302312 | 0.318113 |
| Fibonacci | 0.191042 | 0.213129 | 0.226774 | 0.248862 | 0.270949 | 0.284594 | 0.306682 |
| Pivot points | S3 | S2 | S1 | PP | R1 | R2 | R3 |
|---|---|---|---|---|---|---|---|
| Standard | -0.048571 | 0.092309 | 0.175459 | 0.316339 | 0.399489 | 0.540369 | 0.623519 |
| Camarilla | 0.197001 | 0.217537 | 0.238073 | 0.258609 | 0.279145 | 0.299681 | 0.320217 |
| Woodie | -0.077436 | 0.077877 | 0.146594 | 0.301907 | 0.370624 | 0.525937 | 0.594654 |
| Fibonacci | 0.092309 | 0.177889 | 0.230760 | 0.316339 | 0.401919 | 0.454790 | 0.540369 |
Numerical data
The following is the status of technical indicators and moving averages registered at the time this technical analysis was created:
| RSI (14): | 25.22 | |
| MACD (12,26,9): | -0.0517 | |
| Directional Movement: | -36.494261 | |
| AROON (14): | -57.142857 | |
| DEMA (21): | 0.172344 | |
| Parabolic SAR (0,02-0,02-0,2): | 0.240103 | |
| Elder Ray (13): | -0.045675 | |
| Super Trend (3,10): | 0.245120 | |
| Zig ZAG (10): | 0.170799 | |
| VORTEX (21): | 0.6499 | |
| Stochastique (14,3,5): | 18.29 | |
| TEMA (21): | 0.161805 | |
| Williams %R (14): | -80.90 | |
| Chande Momentum Oscillator (20): | -0.102071 | |
| Repulse (5,40,3): | -8.8680 | |
| ROCnROLL: | 2 | |
| TRIX (15,9): | -2.0854 | |
| Courbe Coppock: | 69.58 |
| MA7: | 0.184215 | |
| MA20: | 0.240656 | |
| MA50: | 0.337375 | |
| MA100: | 0.451507 | |
| MAexp7: | 0.187705 | |
| MAexp20: | 0.240077 | |
| MAexp50: | 0.332798 | |
| MAexp100: | 0.466359 | |
| Price / MA7: | -7.09% | |
| Price / MA20: | -28.88% | |
| Price / MA50: | -49.27% | |
| Price / MA100: | -62.09% | |
| Price / MAexp7: | -8.82% | |
| Price / MAexp20: | -28.71% | |
| Price / MAexp50: | -48.57% | |
| Price / MAexp100: | -63.30% |
About author

Online


Add a comment
Comments
0 comments on the analysis BINARYX - BNX/USDT - Daily