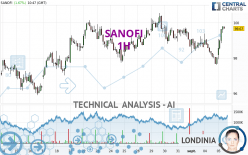
SANOFI - 1H - Technical analysis published on 09/05/2023 (GMT)
- 120
- 0
Click here for a new analysis!
- Timeframe : 1H
- - Analysis generated on
- Status : INVALID

Summary of the analysis

Additional analysis
Quotes
The SANOFI rating is 99.72 EUR. On the day, this instrument gained +1.72% and was traded between 97.93 EUR and 99.79 EUR over the period. The price is currently at +1.83% from its lowest and -0.07% from its highest.A bullish opening was detected by the Central Gaps scanner. Buyers are trying to impose a bullish momentum in the very short term.
Bullish opening
Type : Bullish
Timeframe : Openning
So that you have an overall view of the price change, here is a table showing the variations over several periods:
Near a new HIGH record (5 years)
Type : Bullish
Timeframe : Weekly
Near a new HIGH record (1 year)
Type : Bullish
Timeframe : Weekly
Near a new HIGH record (1st january)
Type : Bullish
Timeframe : Weekly
Near a new HIGH record (1 month)
Type : Bullish
Timeframe : Weekly
Technical
Technical analysis of SANOFI in 1H shows a strongly overall bullish trend. 82.14% of the signals given by moving averages are bullish. This strongly bullish trend is supported by the strong bullish signals given by short-term moving averages. The Central Indicators market scanner is currently detecting a bullish signal that could impact this trend:
Bullish trend reversal : Moving Average 50
Type : Bullish
Timeframe : 1 hour
The technical indicators are bullish. There is still some doubt about the price increase.
Caution: the Central Indicators scanner currently detects an excess:
CCI indicator is overbought : over 100
Type : Neutral
Timeframe : 1 hour
Previous candle closed over Bollinger bands
Type : Neutral
Timeframe : 1 hour
Williams %R indicator is overbought : over -20
Type : Neutral
Timeframe : 1 hour
Pivot points : price is over resistance 1
Type : Neutral
Timeframe : 1 hour
Price is back over the pivot point
Type : Bullish
Timeframe : Weekly
An analysis of the price chart with the Central Patterns scanner (detector of chart patterns and resistances and supports) shows several results that can have an impact on the price change:
Near horizontal resistance
Type : Bearish
Timeframe : 1 hour
Resistance of channel is broken
Type : Bullish
Timeframe : 1 hour
Central Candlesticks, the scanner specialised in Japanese candlesticks, detects a bullish signal that could support the hypothesis of a small rebound in the very short term:
Three white soldiers
Type : Bullish
Timeframe : 1 hour
| S3 | S2 | S1 | Price | R1 | |
|---|---|---|---|---|---|
| ProTrendLines | 95.89 | 97.89 | 99.39 | 99.72 | 100.16 |
| Change (%) | -3.84% | -1.84% | -0.33% | - | +0.44% |
| Change | -3.83 | -1.83 | -0.33 | - | +0.44 |
| Level | Intermediate | Major | Intermediate | - | Major |
Pivot points can also be used to set your price objectives. Here is the price situation in relation to pivot points:
| Pivot points | S3 | S2 | S1 | PP | R1 | R2 | R3 |
|---|---|---|---|---|---|---|---|
| Standard | 95.52 | 96.56 | 97.30 | 98.34 | 99.08 | 100.12 | 100.86 |
| Camarilla | 97.54 | 97.70 | 97.87 | 98.03 | 98.19 | 98.36 | 98.52 |
| Woodie | 95.36 | 96.49 | 97.14 | 98.27 | 98.92 | 100.05 | 100.70 |
| Fibonacci | 96.56 | 97.24 | 97.66 | 98.34 | 99.02 | 99.44 | 100.12 |
| Pivot points | S3 | S2 | S1 | PP | R1 | R2 | R3 |
|---|---|---|---|---|---|---|---|
| Standard | 95.49 | 96.88 | 97.75 | 99.14 | 100.01 | 101.40 | 102.27 |
| Camarilla | 97.99 | 98.20 | 98.40 | 98.61 | 98.82 | 99.02 | 99.23 |
| Woodie | 95.22 | 96.75 | 97.48 | 99.01 | 99.74 | 101.27 | 102.00 |
| Fibonacci | 96.88 | 97.75 | 98.28 | 99.14 | 100.01 | 100.54 | 101.40 |
| Pivot points | S3 | S2 | S1 | PP | R1 | R2 | R3 |
|---|---|---|---|---|---|---|---|
| Standard | 84.39 | 88.00 | 93.32 | 96.93 | 102.25 | 105.86 | 111.18 |
| Camarilla | 96.18 | 97.00 | 97.82 | 98.64 | 99.46 | 100.28 | 101.10 |
| Woodie | 85.25 | 88.43 | 94.18 | 97.36 | 103.11 | 106.29 | 112.04 |
| Fibonacci | 88.00 | 91.41 | 93.52 | 96.93 | 100.34 | 102.45 | 105.86 |
Numerical data
The following is the status of the technical indicators and moving averages at the time of publication of this technical analysis:
| RSI (14): | 63.78 | |
| MACD (12,26,9): | 0.0000 | |
| Directional Movement: | 14.33 | |
| AROON (14): | 28.57 | |
| DEMA (21): | 98.70 | |
| Parabolic SAR (0,02-0,02-0,2): | 97.72 | |
| Elder Ray (13): | 0.81 | |
| Super Trend (3,10): | 98.16 | |
| Zig ZAG (10): | 99.74 | |
| VORTEX (21): | 1.1100 | |
| Stochastique (14,3,5): | 91.54 | |
| TEMA (21): | 98.82 | |
| Williams %R (14): | -1.84 | |
| Chande Momentum Oscillator (20): | 0.75 | |
| Repulse (5,40,3): | 1.2800 | |
| ROCnROLL: | 1 | |
| TRIX (15,9): | -0.0300 | |
| Courbe Coppock: | 0.03 |
| MA7: | 99.02 | |
| MA20: | 98.26 | |
| MA50: | 96.89 | |
| MA100: | 96.64 | |
| MAexp7: | 98.98 | |
| MAexp20: | 98.78 | |
| MAexp50: | 98.89 | |
| MAexp100: | 98.69 | |
| Price / MA7: | +0.71% | |
| Price / MA20: | +1.49% | |
| Price / MA50: | +2.92% | |
| Price / MA100: | +3.19% | |
| Price / MAexp7: | +0.75% | |
| Price / MAexp20: | +0.95% | |
| Price / MAexp50: | +0.84% | |
| Price / MAexp100: | +1.04% |
News
The latest news and videos published on SANOFI at the time of the analysis were as follows:
- Sanofi: Information concerning the total number of voting rights and shares - July 2023
- Press Release: U.S. CDC Advisory Committee unanimously recommends routine use of Beyfortus™ (nirsevimab-alip) to protect infants against RSV disease
- Press release: Online availability of Sanofi’s half-year financial report for 2023
- Press Release: Solid Q2 performance and strong pipeline momentum, Full-year 2023 business EPS guidance raised
- Press Release: Positive topline Phase 2b data in atopic dermatitis support amlitelimab as a potential first and best-in-class novel investigational anti-OX40-ligand monoclonal antibody
About author
Online


Add a comment
Comments
0 comments on the analysis SANOFI - 1H