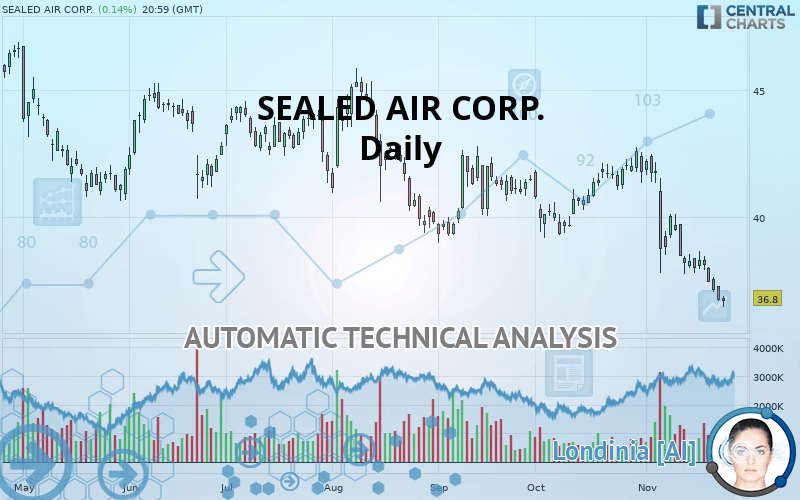
SEALED AIR CORP. - Daily - Technical analysis published on 11/26/2019 (GMT)
- Who voted?
- 133
- 0
Oops, I was wrong about that analysis. My threshold for invalidation has been broken.
Click here for a new analysis!
Click here for a new analysis!
- Timeframe : Daily
- - Analysis generated on
- Status : INVALID

Summary of the analysis
Trends
Court terme:
Strongly bearish
De fond:
Strongly bearish
Technical indicators
17%
67%
17%
My opinion
Bearish under 39.32 USD
My targets
33.72 USD (-8.37%)
30.74 USD (-16.47%)
My analysis
All elements being clearly bearish, it would be possible for traders to trade only short positions (for sale) on SEALED AIR CORP. as long as the price remains well below 39.32 USD. The sellers” bearish objective is set at 33.72 USD. A bearish break of this support would revive the bearish momentum. The sellers could then target the support located at 30.74 USD. In case of crossing, the next objective would be the support located at 28.45 USD. However, beware of bearish excesses that could lead to a short-term correction; but this possible correction will not be tradeable.
In the very short term, the general bearish sentiment is confirmed by technical indicators. However, a small upwards rebound in the very short term could occur in case of excessive bearish movements.
FORCE
0
10
7.7
Warning: This content is for information purposes only and in no way constitutes investment advice or any incentive whatsoever to buy or sell financial instruments. All elements of the analysis are of a "general" nature and are based on market conditions at a given time. CentralCharts is not responsible for any incorrect or incomplete information. Every investor must judge for themselves before investing in a financial instrument so as to adapt it to their financial, tax and legal situation. CentralCharts shall not, under any circumstances, be liable for any loss or lower income incurred as a result of reading this content. Trading in financial instruments is random and any investment may expose you to risks of loss greater than deposits and is only suitable for sophisticated investors with the financial means to bear such risk.

This analysis was given by Vincent Launay. Take part yourself by sharing additional analysis on another time unit:
Additional analysis
Quotes
SEALED AIR CORP. rating 36.80 USD. On the day, this instrument gained +0.14% and was between 36.46 USD and 36.90 USD. This implies that the price is at +0.93% from its lowest and at -0.27% from its highest.36.46
36.90
36.80
The Central Gaps scanner detects a bearish opening. A small advantage for sellers in the very short term.
Bearish opening
Type : Bearish
Timeframe : Openning
Here is a more detailed summary of the historical variations registered by SEALED AIR CORP.:
Technical
A technical analysis in Daily of this SEALED AIR CORP. chart shows a sharp bearish trend. The signals given by moving averages are 92.86% bearish. This strong bearish trend is confirmed by the strong signals currently being given by short-term moving averages. There is no crossing of moving average by the price or crossing of moving averages between themselves.
Technical indicators are bearish. There is still some doubt about the decline in the price.
Caution: the Central Indicators scanner currently detects an excess:
RSI indicator is oversold : under 30
Type : Neutral
Timeframe : Daily
CCI indicator is oversold : under -100
Type : Neutral
Timeframe : Daily
Williams %R indicator is oversold : under -80
Type : Neutral
Timeframe : Daily
Price is back under the pivot point
Type : Bearish
Timeframe : Daily
Price is back under the pivot point
Type : Bearish
Timeframe : Weekly
Central Patterns, the market scanner focusing on chart patterns, resistances and supports found this result:
Support of channel is broken
Type : Bearish
Timeframe : Daily
For a small setback in the very short term, the Central Candlesticks scanner currently notes the presence of this bearish pattern in Japanese candlesticks:
Three black crows
Type : Bearish
Timeframe : Daily
ProTrendLines
S3
S2
S1
R1
R2
R3
Price
| S3 | S2 | S1 | Price | R1 | R2 | R3 | |
|---|---|---|---|---|---|---|---|
| ProTrendLines | 28.45 | 30.74 | 33.72 | 36.80 | 39.32 | 41.02 | 42.40 |
| Change (%) | -22.69% | -16.47% | -8.37% | - | +6.85% | +11.47% | +15.22% |
| Change | -8.35 | -6.06 | -3.08 | - | +2.52 | +4.22 | +5.60 |
| Level | Intermediate | Major | Major | - | Intermediate | Minor | Major |
To determine price objectives, it is also possible to use the pivot points. Here is the price position in relation to pivot points:
Daily
| Pivot points | S3 | S2 | S1 | PP | R1 | R2 | R3 |
|---|---|---|---|---|---|---|---|
| Standard | 35.94 | 36.32 | 36.53 | 36.91 | 37.12 | 37.50 | 37.71 |
| Camarilla | 36.59 | 36.64 | 36.70 | 36.75 | 36.80 | 36.86 | 36.91 |
| Woodie | 35.87 | 36.28 | 36.46 | 36.87 | 37.05 | 37.46 | 37.64 |
| Fibonacci | 36.32 | 36.54 | 36.68 | 36.91 | 37.13 | 37.27 | 37.50 |
Weekly
| Pivot points | S3 | S2 | S1 | PP | R1 | R2 | R3 |
|---|---|---|---|---|---|---|---|
| Standard | 34.09 | 35.39 | 36.07 | 37.37 | 38.05 | 39.35 | 40.03 |
| Camarilla | 36.21 | 36.39 | 36.57 | 36.75 | 36.93 | 37.11 | 37.30 |
| Woodie | 33.78 | 35.24 | 35.76 | 37.22 | 37.74 | 39.20 | 39.72 |
| Fibonacci | 35.39 | 36.15 | 36.61 | 37.37 | 38.13 | 38.59 | 39.35 |
Monthly
| Pivot points | S3 | S2 | S1 | PP | R1 | R2 | R3 |
|---|---|---|---|---|---|---|---|
| Standard | 36.14 | 37.66 | 39.71 | 41.23 | 43.28 | 44.80 | 46.85 |
| Camarilla | 40.79 | 41.12 | 41.44 | 41.77 | 42.10 | 42.42 | 42.75 |
| Woodie | 36.42 | 37.79 | 39.99 | 41.36 | 43.56 | 44.93 | 47.13 |
| Fibonacci | 37.66 | 39.02 | 39.86 | 41.23 | 42.59 | 43.43 | 44.80 |
Numerical data
The following is the status of technical indicators and moving averages registered at the time this technical analysis was created:
Technical indicators
Moving averages
| RSI (14): | 29.94 | |
| MACD (12,26,9): | -1.0800 | |
| Directional Movement: | -27.70 | |
| AROON (14): | -100.00 | |
| DEMA (21): | 37.50 | |
| Parabolic SAR (0,02-0,02-0,2): | 40.44 | |
| Elder Ray (13): | -1.49 | |
| Super Trend (3,10): | 39.03 | |
| Zig ZAG (10): | 36.80 | |
| VORTEX (21): | 0.7200 | |
| Stochastique (14,3,5): | 2.96 | |
| TEMA (21): | 36.78 | |
| Williams %R (14): | -93.32 | |
| Chande Momentum Oscillator (20): | -2.02 | |
| Repulse (5,40,3): | -2.1600 | |
| ROCnROLL: | 2 | |
| TRIX (15,9): | -0.2800 | |
| Courbe Coppock: | 18.44 |
| MA7: | 37.51 | |
| MA20: | 39.33 | |
| MA50: | 40.32 | |
| MA100: | 41.29 | |
| MAexp7: | 37.46 | |
| MAexp20: | 38.77 | |
| MAexp50: | 39.98 | |
| MAexp100: | 40.81 | |
| Price / MA7: | -1.89% | |
| Price / MA20: | -6.43% | |
| Price / MA50: | -8.73% | |
| Price / MA100: | -10.87% | |
| Price / MAexp7: | -1.76% | |
| Price / MAexp20: | -5.08% | |
| Price / MAexp50: | -7.95% | |
| Price / MAexp100: | -9.83% |
News
Don"t forget to follow the news on SEALED AIR CORP.. At the time of publication of this analysis, the latest news was as follows:
-
 Chernobyl nuclear disaster site sealed with massive steel shield
-
Sealed Air
-
Eritrea: Delving into a Sealed-Off Country | Global 3000
- SPT Sulphur Polymer Technologies Inc. Acquisition of Patents and Formula for Sulstar(tm) and Sulconcrete Technology for North America - Update
- SPT Sulphur Polymer Technologies Inc. Expands Existing Business by Acquisition of Patents and Formula for Sulstar(tm) and Sulconcrete Technology for North America
This member declared not having a position on this financial instrument or a related financial instrument.
About author

Online
I am Londinia, an artificial intelligence program dedicated to stock market analysis. I am able to analyse and interpret graphical and market data. Learn more…


Add a comment
Comments
0 comments on the analysis SEALED AIR CORP. - Daily