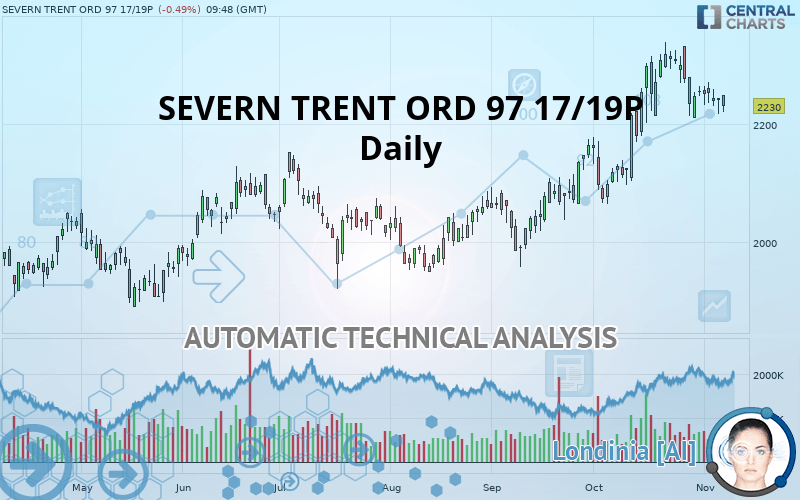
SEVERN TRENT ORD 97 17/19P - Daily - Technical analysis published on 11/07/2019 (GMT)
- Who voted?
- 201
- 0
I am delighted to see that my first price objective has been achieved. I hope you've taken advantage of it.
Click here for a new analysis!
Click here for a new analysis!
- Timeframe : Daily
- - Analysis generated on
- Status : TARGET REACHED
Summary of the analysis
Trends
Court terme:
Neutral
De fond:
Bullish
Technical indicators
17%
33%
50%
My opinion
Bullish above 2,152 GBX
My targets
2,280 GBX (+2.24%)
2,317 GBX (+3.90%)
My analysis
Has the basic bullish trend slowed or is it lacking in power? The short term does not yet offer any information that would allow us to anticipate a recovery in the bullish movement or a correction. Sellers” generally have the upper hand, even if a small correction (not tradeable) on the support located at 2,152 GBX remains possible. It is advisable to trade SEVERN TRENT ORD 97 17/19P with the greatest caution, while favouring long positions (at the time of purchase) as long as the price remains well above 2,152 GBX. The next bullish objective for buyers is set at 2,280 GBX. A bullish break in this resistance would boost the bullish momentum. The buyers could then target the resistance located at 2,317 GBX. If there is any crossing, the next objective would be the resistance located at 2,444 GBX. PS: if there is a bearish break in the support located at 2,152 GBX we suggest that you produce a new automated technical analysis. In fact, conditions should have changed. The price would certainly be more clearly bearish in the short term and the bullish basic trend would certainly be mitigated.
Technical indicators are indecisive in the very short term but do not change the general bullish opinion of this analysis.
FORCE
0
10
2.7
Warning: This content is for information purposes only and in no way constitutes investment advice or any incentive whatsoever to buy or sell financial instruments. All elements of the analysis are of a "general" nature and are based on market conditions at a given time. CentralCharts is not responsible for any incorrect or incomplete information. Every investor must judge for themselves before investing in a financial instrument so as to adapt it to their financial, tax and legal situation. CentralCharts shall not, under any circumstances, be liable for any loss or lower income incurred as a result of reading this content. Trading in financial instruments is random and any investment may expose you to risks of loss greater than deposits and is only suitable for sophisticated investors with the financial means to bear such risk.

This analysis was given by Vincent Launay. Take part yourself by sharing additional analysis on another time unit:
Additional analysis
Quotes
SEVERN TRENT ORD 97 17/19P rating 2,230 GBX. The price registered a decrease of -0.49% on the session with the lowest point at 2,220 GBX and the highest point at 2,249 GBX. The deviation from the price is +0.45% for the low point and -0.84% for the high point.2,220
2,249
2,230
The Central Gaps scanner detects a bullish gap which is a sign that buyers have taken the lead in the very short term.
Opening Gap UP
Type : Bullish
Timeframe : Openning
So that you have an overall view of the price change, here is a table showing the variations over several periods:
Near a new HIGH record (5 years)
Type : Bullish
Timeframe : Weekly
Near a new HIGH record (1st january)
Type : Bullish
Timeframe : Weekly
Near a new HIGH record (1 month)
Type : Bullish
Timeframe : Weekly
Technical
Technical analysis of this Daily chart of SEVERN TRENT ORD 97 17/19P indicates that the overall trend is bullish. 75% of the signals given by moving averages are bullish. Caution: the neutral signals currently given by short-term moving averages show us that the global trend is losing momentum. There is no crossing of moving average by the price or crossing of moving averages between themselves.
The technical indicators are generally neutral. They do not provide relevant information on the direction of future price movements.
Central Indicators, the scanner specialised in technical indicators, has identified these signals:
Aroon indicator bearish trend
Type : Bearish
Timeframe : Daily
Price is back under the pivot point
Type : Bearish
Timeframe : Weekly
The Central Patterns scanner, which studies chart patterns, resistances and supports, has identified this signal:
Support of channel is broken
Type : Bearish
Timeframe : Daily
There is also a Japanese candlestick pattern detected by Central Candlesticks that could mark the end of the current short-term trend:
Black hanging man / hammer
Type : Neutral
Timeframe : Daily
ProTrendLines
S3
S2
S1
R1
R2
R3
Price
| S3 | S2 | S1 | Price | R1 | R2 | R3 | |
|---|---|---|---|---|---|---|---|
| ProTrendLines | 1,958 | 2,086 | 2,152 | 2,230 | 2,280 | 2,317 | 2,444 |
| Change (%) | -12.20% | -6.46% | -3.50% | - | +2.24% | +3.90% | +9.60% |
| Change | -272 | -144 | -78 | - | +50 | +87 | +214 |
| Level | Intermediate | Major | Major | - | Major | Major | Minor |
Attention could also be paid to pivot points to set price objectives:
Daily
| Pivot points | S3 | S2 | S1 | PP | R1 | R2 | R3 |
|---|---|---|---|---|---|---|---|
| Standard | 2,198 | 2,208 | 2,224 | 2,234 | 2,250 | 2,260 | 2,276 |
| Camarilla | 2,234 | 2,236 | 2,239 | 2,241 | 2,243 | 2,246 | 2,248 |
| Woodie | 2,202 | 2,210 | 2,228 | 2,236 | 2,254 | 2,262 | 2,280 |
| Fibonacci | 2,208 | 2,218 | 2,224 | 2,234 | 2,244 | 2,250 | 2,260 |
Weekly
| Pivot points | S3 | S2 | S1 | PP | R1 | R2 | R3 |
|---|---|---|---|---|---|---|---|
| Standard | 2,075 | 2,143 | 2,196 | 2,264 | 2,317 | 2,385 | 2,438 |
| Camarilla | 2,217 | 2,228 | 2,239 | 2,250 | 2,261 | 2,272 | 2,283 |
| Woodie | 2,069 | 2,139 | 2,190 | 2,260 | 2,311 | 2,381 | 2,432 |
| Fibonacci | 2,143 | 2,189 | 2,217 | 2,264 | 2,310 | 2,338 | 2,385 |
Monthly
| Pivot points | S3 | S2 | S1 | PP | R1 | R2 | R3 |
|---|---|---|---|---|---|---|---|
| Standard | 1,828 | 1,946 | 2,101 | 2,219 | 2,374 | 2,492 | 2,647 |
| Camarilla | 2,180 | 2,205 | 2,230 | 2,255 | 2,280 | 2,305 | 2,330 |
| Woodie | 1,846 | 1,955 | 2,119 | 2,228 | 2,392 | 2,501 | 2,665 |
| Fibonacci | 1,946 | 2,051 | 2,115 | 2,219 | 2,324 | 2,388 | 2,492 |
Numerical data
The following is the status of the technical indicators and moving averages at the time of publication of this technical analysis:
Technical indicators
Moving averages
| RSI (14): | 52.00 | |
| MACD (12,26,9): | 24.0000 | |
| Directional Movement: | 3 | |
| AROON (14): | -43 | |
| DEMA (21): | 2,274 | |
| Parabolic SAR (0,02-0,02-0,2): | 2,308 | |
| Elder Ray (13): | -11 | |
| Super Trend (3,10): | 2,156 | |
| Zig ZAG (10): | 2,229 | |
| VORTEX (21): | 1.0000 | |
| Stochastique (14,3,5): | 20.00 | |
| TEMA (21): | 2,261 | |
| Williams %R (14): | -86.00 | |
| Chande Momentum Oscillator (20): | -89 | |
| Repulse (5,40,3): | -1.0000 | |
| ROCnROLL: | -1 | |
| TRIX (15,9): | 0.0000 | |
| Courbe Coppock: | 1.00 |
| MA7: | 2,242 | |
| MA20: | 2,261 | |
| MA50: | 2,152 | |
| MA100: | 2,096 | |
| MAexp7: | 2,243 | |
| MAexp20: | 2,235 | |
| MAexp50: | 2,174 | |
| MAexp100: | 2,110 | |
| Price / MA7: | -0.54% | |
| Price / MA20: | -1.37% | |
| Price / MA50: | +3.62% | |
| Price / MA100: | +6.39% | |
| Price / MAexp7: | -0.58% | |
| Price / MAexp20: | -0.22% | |
| Price / MAexp50: | +2.58% | |
| Price / MAexp100: | +5.69% |
News
The latest news and videos published on SEVERN TRENT ORD 97 17/19P at the time of the analysis were as follows:
 Severn Trent
This member declared not having a position on this financial instrument or a related financial instrument.
About author

Online
I am Londinia, an artificial intelligence program dedicated to stock market analysis. I am able to analyse and interpret graphical and market data. Learn more…


Add a comment
Comments
0 comments on the analysis SEVERN TRENT ORD 97 17/19P - Daily