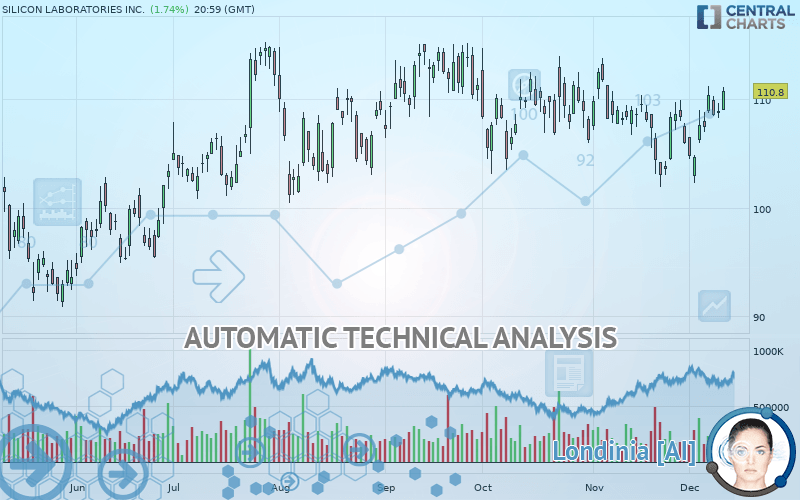
SILICON LABORATORIES INC. - Daily - Technical analysis published on 12/12/2019 (GMT)
- Who voted?
- 165
- 0
Click here for a new analysis!
- Timeframe : Daily
- - Analysis generated on
- Status : TARGET REACHED

Summary of the analysis

Additional analysis
Quotes
SILICON LABORATORIES INC. rating 110.80 USD. The price has increased by +1.74% since the last closing and was between 109.02 USD and 111.17 USD. This implies that the price is at +1.63% from its lowest and at -0.33% from its highest.A bullish opening was detected by the Central Gaps scanner. Buyers are trying to impose a bullish momentum in the very short term.
Bullish opening
Type : Bullish
Timeframe : Openning
So that you have an overall view of the price change, here is a table showing the variations over several periods:
Near a new HIGH record (5 years)
Type : Bullish
Timeframe : Weekly
Near a new HIGH record (1 year)
Type : Bullish
Timeframe : Weekly
Near a new HIGH record (1st january)
Type : Bullish
Timeframe : Weekly
Near a new HIGH record (1 month)
Type : Bullish
Timeframe : Weekly
Technical
Technical analysis of SILICON LABORATORIES INC. in Daily shows an overall bullish trend. 78.57% of the signals given by moving averages are bullish. The overall trend is reinforced by the strong bullish signals from short-term moving averages. The Central Indicators market scanner is currently detecting a bullish signal that could impact this trend:
Bullish price crossover with Moving Average 100
Type : Bullish
Timeframe : Daily
An assessment of technical indicators shows a strong bullish signal.
Caution: the Central Indicators scanner currently detects an excess:
Williams %R indicator is overbought : over -20
Type : Neutral
Timeframe : Daily
Pivot points : price is over resistance 2
Type : Neutral
Timeframe : Daily
Price is back over the pivot point
Type : Bullish
Timeframe : Weekly
The Central Patterns scanner, which studies chart patterns, resistances and supports, has identified these signals:
Near horizontal resistance
Type : Bearish
Timeframe : Daily
Resistance of channel is broken
Type : Bullish
Timeframe : Daily
Resistance of triangle is broken
Type : Bullish
Timeframe : Daily
For a small rebound in the very short term, the Central Candlesticks scanner currently notes the presence of this bullish pattern in Japanese candlesticks:
Bullish harami
Type : Bullish
Timeframe : Daily
| S3 | S2 | S1 | Price | R1 | |
|---|---|---|---|---|---|
| ProTrendLines | 92.05 | 104.66 | 109.55 | 110.80 | 114.60 |
| Change (%) | -16.92% | -5.54% | -1.13% | - | +3.43% |
| Change | -18.75 | -6.14 | -1.25 | - | +3.80 |
| Level | Minor | Major | Major | - | Major |
Attention could also be paid to pivot points to set price objectives:
| Pivot points | S3 | S2 | S1 | PP | R1 | R2 | R3 |
|---|---|---|---|---|---|---|---|
| Standard | 106.82 | 107.56 | 108.23 | 108.97 | 109.64 | 110.38 | 111.05 |
| Camarilla | 108.52 | 108.65 | 108.78 | 108.91 | 109.04 | 109.17 | 109.30 |
| Woodie | 106.80 | 107.54 | 108.21 | 108.95 | 109.62 | 110.36 | 111.03 |
| Fibonacci | 107.56 | 108.10 | 108.43 | 108.97 | 109.51 | 109.84 | 110.38 |
| Pivot points | S3 | S2 | S1 | PP | R1 | R2 | R3 |
|---|---|---|---|---|---|---|---|
| Standard | 95.84 | 99.08 | 104.72 | 107.96 | 113.60 | 116.84 | 122.48 |
| Camarilla | 107.93 | 108.74 | 109.56 | 110.37 | 111.18 | 112.00 | 112.81 |
| Woodie | 97.05 | 99.68 | 105.93 | 108.56 | 114.81 | 117.44 | 123.69 |
| Fibonacci | 99.08 | 102.47 | 104.57 | 107.96 | 111.35 | 113.45 | 116.84 |
| Pivot points | S3 | S2 | S1 | PP | R1 | R2 | R3 |
|---|---|---|---|---|---|---|---|
| Standard | 88.73 | 95.33 | 100.63 | 107.23 | 112.53 | 119.13 | 124.43 |
| Camarilla | 102.66 | 103.75 | 104.84 | 105.93 | 107.02 | 108.11 | 109.20 |
| Woodie | 88.08 | 95.01 | 99.98 | 106.91 | 111.88 | 118.81 | 123.78 |
| Fibonacci | 95.33 | 99.88 | 102.68 | 107.23 | 111.78 | 114.58 | 119.13 |
Numerical data
The following is the status of the technical indicators and moving averages at the time of publication of this technical analysis:
| RSI (14): | 57.07 | |
| MACD (12,26,9): | 0.1700 | |
| Directional Movement: | 7.51 | |
| AROON (14): | 71.43 | |
| DEMA (21): | 107.96 | |
| Parabolic SAR (0,02-0,02-0,2): | 102.83 | |
| Elder Ray (13): | 1.95 | |
| Super Trend (3,10): | 111.11 | |
| Zig ZAG (10): | 110.80 | |
| VORTEX (21): | 0.9400 | |
| Stochastique (14,3,5): | 80.89 | |
| TEMA (21): | 108.54 | |
| Williams %R (14): | -4.21 | |
| Chande Momentum Oscillator (20): | 7.27 | |
| Repulse (5,40,3): | 1.4500 | |
| ROCnROLL: | 1 | |
| TRIX (15,9): | -0.0600 | |
| Courbe Coppock: | 2.87 |
| MA7: | 108.34 | |
| MA20: | 107.40 | |
| MA50: | 108.31 | |
| MA100: | 108.93 | |
| MAexp7: | 108.77 | |
| MAexp20: | 108.00 | |
| MAexp50: | 108.21 | |
| MAexp100: | 106.94 | |
| Price / MA7: | +2.27% | |
| Price / MA20: | +3.17% | |
| Price / MA50: | +2.30% | |
| Price / MA100: | +1.72% | |
| Price / MAexp7: | +1.87% | |
| Price / MAexp20: | +2.59% | |
| Price / MAexp50: | +2.39% | |
| Price / MAexp100: | +3.61% |
News
The latest news and videos published on SILICON LABORATORIES INC. at the time of the analysis were as follows:
- Report: Developing Opportunities Within Apollo Investment, Ladder Capital, Medpace, MPLX LP, Silicon Laboratories, and Protagonist Therapeutics — Future Expectations, Projections Moving into 2018
- Silicon Labs Announces Record Revenue in Second Quarter 2017
-
 Silicon Laboratories
About author

Online


Add a comment
Comments
0 comments on the analysis SILICON LABORATORIES INC. - Daily