SII - Daily - Technical analysis published on 12/28/2023 (GMT)
- 89
- 0
- Timeframe : Daily
- - Analysis generated on
- Status : WITHOUT TARGET
Summary of the analysis
Additional analysis
Quotes
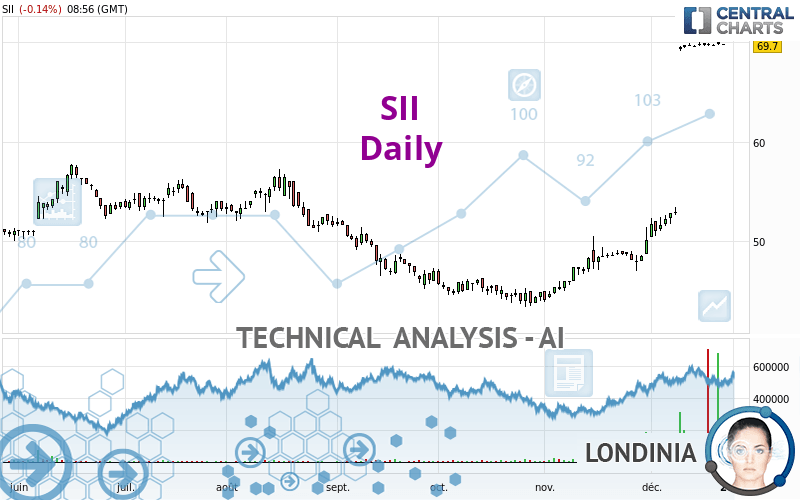
The SII price is 69.7 EUR. On the day, this instrument lost -0.14% and was traded between 69.7 EUR and 69.8 EUR over the period. The price is currently at 0% from its lowest and -0.14% from its highest.A study of price movements over other periods shows the following variations:
New HIGH record (5 years)
Type : Bullish
Timeframe : Weekly
Near a new HIGH record (1 year)
Type : Bullish
Timeframe : Weekly
Near a new HIGH record (1st january)
Type : Bullish
Timeframe : Weekly
Near a new HIGH record (1 month)
Type : Bullish
Timeframe : Weekly
The Central Volumes scanner detects abnormal volumes on the asset:
Abnormal volumes
Timeframe : 5 days
Abnormal volumes
Timeframe : 20 days
Abnormal volumes
Timeframe : 50 days
Technical
A technical analysis in Daily of this SII chart shows a strongly bullish trend. The signals given by the moving averages are 92.86% bullish. This strong bullish trend is confirmed by the strong signals currently being given by short-term moving averages. The Central Indicators scanner does not detect any result on moving averages that would impact this trend.
In fact, 12 technical indicators on 18 studied are currently positioned bullish. But beware of excesses. The Central Indicators scanner currently detects this:
RSI indicator is overbought : over 90
Type : Neutral
Timeframe : Daily
RSI indicator: bearish divergence
Type : Bearish
Timeframe : Daily
Williams %R indicator is overbought : over -20
Type : Neutral
Timeframe : Daily
Price is back under the pivot point
Type : Bearish
Timeframe : Weekly
The Central Patterns scanner, which studies chart patterns, resistances and supports, has identified this signal:
Near resistance of channel
Type : Bearish
Timeframe : Daily
No result was found by the Central Candlesticks scanner on Japanese candlesticks.
| S3 | S2 | S1 | Price | |
|---|---|---|---|---|
| ProTrendLines | 48.0 | 52.0 | 57.1 | 69.7 |
| Change (%) | -31.13% | -25.39% | -18.08% | - |
| Change | -21.7 | -17.7 | -12.6 | - |
| Level | Major | Major | Major | - |
To determine price objectives, it is also possible to use the pivot points. Here is the price position in relation to pivot points:
| Pivot points | S3 | S2 | S1 | PP | R1 | R2 | R3 |
|---|---|---|---|---|---|---|---|
| Standard | 69.4 | 69.5 | 69.7 | 69.8 | 70.0 | 70.1 | 70.3 |
| Camarilla | 69.7 | 69.8 | 69.8 | 69.8 | 69.8 | 69.9 | 69.9 |
| Woodie | 69.4 | 69.5 | 69.7 | 69.8 | 70.0 | 70.1 | 70.3 |
| Fibonacci | 69.5 | 69.7 | 69.7 | 69.8 | 70.0 | 70.0 | 70.1 |
| Pivot points | S3 | S2 | S1 | PP | R1 | R2 | R3 |
|---|---|---|---|---|---|---|---|
| Standard | 69.0 | 69.2 | 69.5 | 69.7 | 70.0 | 70.2 | 70.5 |
| Camarilla | 69.6 | 69.6 | 69.7 | 69.7 | 69.8 | 69.8 | 69.8 |
| Woodie | 69.0 | 69.2 | 69.5 | 69.7 | 70.0 | 70.2 | 70.5 |
| Fibonacci | 69.2 | 69.4 | 69.5 | 69.7 | 69.9 | 70.0 | 70.2 |
| Pivot points | S3 | S2 | S1 | PP | R1 | R2 | R3 |
|---|---|---|---|---|---|---|---|
| Standard | 38.0 | 41.0 | 45.5 | 48.5 | 53.0 | 56.0 | 60.5 |
| Camarilla | 48.0 | 48.7 | 49.4 | 50.1 | 50.8 | 51.5 | 52.2 |
| Woodie | 38.9 | 41.4 | 46.4 | 48.9 | 53.9 | 56.4 | 61.4 |
| Fibonacci | 41.0 | 43.8 | 45.6 | 48.5 | 51.3 | 53.1 | 56.0 |
Numerical data
The following is the status of the technical indicators and moving averages at the time of publication of this technical analysis:
| RSI (14): | 90.70 | |
| MACD (12,26,9): | 5.9000 | |
| Directional Movement: | 60.0 | |
| AROON (14): | 64.3 | |
| DEMA (21): | 69.8 | |
| Parabolic SAR (0,02-0,02-0,2): | 66.7 | |
| Elder Ray (13): | 4.1 | |
| Super Trend (3,10): | 66.1 | |
| Zig ZAG (10): | 69.7 | |
| VORTEX (21): | 1.1000 | |
| Stochastique (14,3,5): | 98.60 | |
| TEMA (21): | 73.0 | |
| Williams %R (14): | -1.60 | |
| Chande Momentum Oscillator (20): | 17.5 | |
| Repulse (5,40,3): | -0.2000 | |
| ROCnROLL: | 1 | |
| TRIX (15,9): | 1.5000 | |
| Courbe Coppock: | 77.20 |
| MA7: | 69.8 | |
| MA20: | 60.2 | |
| MA50: | 51.8 | |
| MA100: | 50.6 | |
| MAexp7: | 68.7 | |
| MAexp20: | 62.4 | |
| MAexp50: | 55.5 | |
| MAexp100: | 52.5 | |
| Price / MA7: | -0.14% | |
| Price / MA20: | +15.78% | |
| Price / MA50: | +34.56% | |
| Price / MA100: | +37.75% | |
| Price / MAexp7: | +1.46% | |
| Price / MAexp20: | +11.70% | |
| Price / MAexp50: | +25.59% | |
| Price / MAexp100: | +32.76% |
News
Don't forget to follow the news on SII. At the time of publication of this analysis, the latest news was as follows:
- SII : Résultats du premier semestre de l’exercice 2023/2024
- SII : Chiffre d’affaires du premier semestre 2023/2024
- SII : Comptes annuels 2022/2023
- SII : SII acquiert METANEXT
- SII : Résultats du premier semestre de l’exercice 2022/2023
About author

Online


Add a comment
Comments
0 comments on the analysis SII - Daily