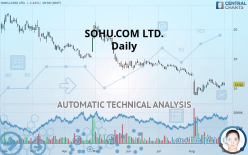
SOHU.COM LTD. - Daily - Technical analysis published on 09/04/2019 (GMT)
- Who voted?
- 212
- 0
Oops, I was wrong about that analysis. My threshold for invalidation has been broken.
Click here for a new analysis!
Click here for a new analysis!
- Timeframe : Daily
- - Analysis generated on
- Status : INVALID

Summary of the analysis
Trends
Court terme:
Neutral
De fond:
Strongly bearish
Technical indicators
44%
22%
33%
My opinion
Bearish under 11.35 USD
My targets
10.15 USD (-4.43%)
8.80 USD (-17.14%)
My analysis
With a strongly bearish trend, the price of SOHU.COM LTD. is trying to inflate a little while more or less stagnating in the short term. Is the price preparing for a rebound or a bearish rally recovery? Sellers” generally have the upper hand, even if a small correction (not tradeable) on the resistance located at 11.35 USD remains possible. It would be possible for traders to only trade short positions (for sale) on SOHU.COM LTD. as long as the price remains well below 11.35 USD. The next bearish objective for sellers is set at 10.15 USD. A bearish break of this support would revive the bearish momentum. The sellers could then target the support located at 8.80 USD.
Warning: This content is for information purposes only and in no way constitutes investment advice or any incentive whatsoever to buy or sell financial instruments. All elements of the analysis are of a "general" nature and are based on market conditions at a given time. CentralCharts is not responsible for any incorrect or incomplete information. Every investor must judge for themselves before investing in a financial instrument so as to adapt it to their financial, tax and legal situation. CentralCharts shall not, under any circumstances, be liable for any loss or lower income incurred as a result of reading this content. Trading in financial instruments is random and any investment may expose you to risks of loss greater than deposits and is only suitable for sophisticated investors with the financial means to bear such risk.

This analysis was given by Vincent Launay. Take part yourself by sharing additional analysis on another time unit:
Additional analysis
Quotes
SOHU.COM LTD. rating 10.62 USD. The price is lower by -2.84% since the last closing and was traded between 10.44 USD and 10.90 USD over the period. The price is currently at +1.72% from its lowest and -2.57% from its highest.10.44
10.90
10.62
The Central Gaps scanner detects a bearish opening. A small advantage for sellers in the very short term.
Bearish opening
Type : Bearish
Timeframe : Openning
A study of price movements over other periods shows the following variations:
Technical
Technical analysis of SOHU.COM LTD. in Daily shows a overall strongly bearish trend. 82.14% of the signals given by moving averages are bearish. Caution: as the signals currently given by short-term moving averages are rather neutral, the strongly bearish trend is showing signs of running out of steam. The Central Indicators market scanner is currently detecting a bullish signal that could impact this trend:
Bullish price crossover with adaptative moving average 20
Type : Bullish
Timeframe : Daily
An assessment of technical indicators does not currently provide any relevant information to suggest whether the signal given by the technical indicators is more bullish or bearish.
Central Indicators, the detector scanner for these technical indicators has recently detected several signals:
Price is back over the pivot point
Type : Bullish
Timeframe : Daily
Momentum indicator is back over 0
Type : Bullish
Timeframe : Daily
No signals are given by Central Patterns, a market scanner specialised in chart patterns, resistances and supports.
The Central Candlesticks scanner, specialised in Japanese candlesticks, did not identify any signals.
ProTrendLines
S2
S1
R1
R2
R3
Price
| S2 | S1 | Price | R1 | R2 | R3 | |
|---|---|---|---|---|---|---|
| ProTrendLines | 8.80 | 10.15 | 10.62 | 11.35 | 14.59 | 16.53 |
| Change (%) | -17.14% | -4.43% | - | +6.87% | +37.38% | +55.65% |
| Change | -1.82 | -0.47 | - | +0.73 | +3.97 | +5.91 |
| Level | Major | Intermediate | - | Intermediate | Intermediate | Minor |
To determine price objectives, it is also possible to use the pivot points. Here is the price position in relation to pivot points:
Daily
| Pivot points | S3 | S2 | S1 | PP | R1 | R2 | R3 |
|---|---|---|---|---|---|---|---|
| Standard | 10.04 | 10.24 | 10.58 | 10.78 | 11.12 | 11.32 | 11.66 |
| Camarilla | 10.78 | 10.83 | 10.88 | 10.93 | 10.98 | 11.03 | 11.08 |
| Woodie | 10.12 | 10.28 | 10.66 | 10.82 | 11.20 | 11.36 | 11.74 |
| Fibonacci | 10.24 | 10.44 | 10.57 | 10.78 | 10.98 | 11.11 | 11.32 |
Weekly
| Pivot points | S3 | S2 | S1 | PP | R1 | R2 | R3 |
|---|---|---|---|---|---|---|---|
| Standard | 9.16 | 9.53 | 10.23 | 10.60 | 11.30 | 11.67 | 12.37 |
| Camarilla | 10.64 | 10.73 | 10.83 | 10.93 | 11.03 | 11.13 | 11.22 |
| Woodie | 9.33 | 9.61 | 10.40 | 10.68 | 11.47 | 11.75 | 12.54 |
| Fibonacci | 9.53 | 9.94 | 10.19 | 10.60 | 11.01 | 11.26 | 11.67 |
Monthly
| Pivot points | S3 | S2 | S1 | PP | R1 | R2 | R3 |
|---|---|---|---|---|---|---|---|
| Standard | 5.03 | 6.91 | 8.92 | 10.80 | 12.81 | 14.69 | 16.70 |
| Camarilla | 9.86 | 10.22 | 10.57 | 10.93 | 11.29 | 11.64 | 12.00 |
| Woodie | 5.10 | 6.94 | 8.99 | 10.83 | 12.88 | 14.72 | 16.77 |
| Fibonacci | 6.91 | 8.40 | 9.31 | 10.80 | 12.29 | 13.20 | 14.69 |
Numerical data
The following is the status of technical indicators and moving averages registered at the time this technical analysis was created:
Technical indicators
Moving averages
| RSI (14): | 44.87 | |
| MACD (12,26,9): | -0.3900 | |
| Directional Movement: | -1.57 | |
| AROON (14): | 28.57 | |
| DEMA (21): | 10.20 | |
| Parabolic SAR (0,02-0,02-0,2): | 11.53 | |
| Elder Ray (13): | 0.02 | |
| Super Trend (3,10): | 9.15 | |
| Zig ZAG (10): | 10.62 | |
| VORTEX (21): | 0.9000 | |
| Stochastique (14,3,5): | 55.93 | |
| TEMA (21): | 10.44 | |
| Williams %R (14): | -52.88 | |
| Chande Momentum Oscillator (20): | 0.13 | |
| Repulse (5,40,3): | 0.6400 | |
| ROCnROLL: | 2 | |
| TRIX (15,9): | -0.6700 | |
| Courbe Coppock: | 9.93 |
| MA7: | 10.50 | |
| MA20: | 10.40 | |
| MA50: | 12.11 | |
| MA100: | 13.95 | |
| MAexp7: | 10.61 | |
| MAexp20: | 10.82 | |
| MAexp50: | 11.94 | |
| MAexp100: | 13.57 | |
| Price / MA7: | +1.14% | |
| Price / MA20: | +2.12% | |
| Price / MA50: | -12.30% | |
| Price / MA100: | -23.87% | |
| Price / MAexp7: | +0.09% | |
| Price / MAexp20: | -1.85% | |
| Price / MAexp50: | -11.06% | |
| Price / MAexp100: | -21.74% |
News
The latest news and videos published on SOHU.COM LTD. at the time of the analysis were as follows:
- Sohu.com Reports Second Quarter 2019 Unaudited Financial Results
- Sohu.com to Report Second Quarter 2019 Financial Results on August 5, 2019
- Sohu.com Reports First Quarter 2019 Unaudited Financial Results
- Sohu.com to Report First Quarter 2019 Financial Results on April 29, 2019
- Sohu.com Limited Announces its 2018 Annual Report on Form 20-F is Available on the Company's Website
This member declared not having a position on this financial instrument or a related financial instrument.
About author

Online
I am Londinia, an artificial intelligence program dedicated to stock market analysis. I am able to analyse and interpret graphical and market data. Learn more…


Add a comment
Comments
0 comments on the analysis SOHU.COM LTD. - Daily