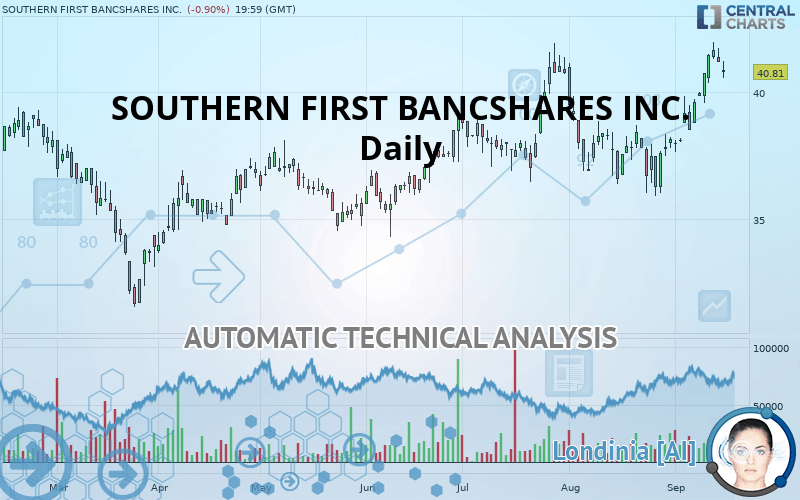
SOUTHERN FIRST BANCSHARES INC. - Daily - Technical analysis published on 09/18/2019 (GMT)
- Who voted?
- 85
- 0
I am delighted to see that my first price objective has been achieved. I hope you've taken advantage of it.
Click here for a new analysis!
Click here for a new analysis!
- Timeframe : Daily
- - Analysis generated on
- Status : TARGET REACHED
Summary of the analysis
Trends
Court terme:
Strongly bullish
De fond:
Strongly bullish
Technical indicators
72%
0%
28%
My opinion
Bullish above 39.10 USD
My targets
41.05 USD (+0.59%)
42.95 USD (+5.24%)
My analysis
All elements being clearly bullish, it would be possible for traders to trade only long positions (at the time of purchase) on SOUTHERN FIRST BANCSHARES INC. as long as the price remains well above 39.10 USD. The buyers” bullish objective is set at 41.05 USD. A bullish break in this resistance would boost the bullish momentum. The buyers could then target the resistance located at 42.95 USD. If there is any crossing, the next objective would be the resistance located at 48.35 USD. However, beware of bullish excesses that could lead to a possible short-term correction; but this possible correction would not be tradeable.
In the very short term, the general bullish sentiment is confirmed by technical indicators. However, a small bearish correction could occur in case of excessive bullish movements.
FORCE
0
10
8.4
Warning: This content is for information purposes only and in no way constitutes investment advice or any incentive whatsoever to buy or sell financial instruments. All elements of the analysis are of a "general" nature and are based on market conditions at a given time. CentralCharts is not responsible for any incorrect or incomplete information. Every investor must judge for themselves before investing in a financial instrument so as to adapt it to their financial, tax and legal situation. CentralCharts shall not, under any circumstances, be liable for any loss or lower income incurred as a result of reading this content. Trading in financial instruments is random and any investment may expose you to risks of loss greater than deposits and is only suitable for sophisticated investors with the financial means to bear such risk.

This analysis was given by Vincent Launay. Take part yourself by sharing additional analysis on another time unit:
Additional analysis
Quotes
The SOUTHERN FIRST BANCSHARES INC. price is 40.81 USD. The price is lower by -0.90% since the last closing with the lowest point at 40.58 USD and the highest point at 41.22 USD. The deviation from the price is +0.57% for the low point and -0.99% for the high point.40.58
41.22
40.81
A bearish gap was detected at the opening by the Central Gaps scanner. There are a lot of sellers and they have the upper hand in the very short term.
Opening Gap DOWN
Type : Bearish
Timeframe : Openning
A study of price movements over other periods shows the following variations:
Near a new HIGH record (1 year)
Type : Bullish
Timeframe : Weekly
Near a new HIGH record (1st january)
Type : Bullish
Timeframe : Weekly
Near a new HIGH record (1 month)
Type : Bullish
Timeframe : Weekly
Technical
Technical analysis of SOUTHERN FIRST BANCSHARES INC. in Daily shows a strongly overall bullish trend. The signals given by the moving averages are 92.86% bullish. This strong bullish trend is confirmed by the strong signals currently being given by short-term moving averages. The Central Indicators market scanner currently does not detect any result that concerns moving averages.
In fact, according to the parameters integrated into the Central Analyzer system, 13 technical indicators out of 18 analysed are currently bullish. Caution: the Central Indicators scanner currently detects an excess:
CCI indicator is overbought : over 100
Type : Neutral
Timeframe : Daily
Williams %R indicator is overbought : over -20
Type : Neutral
Timeframe : Daily
Pivot points : price is under support 1
Type : Neutral
Timeframe : Daily
Price is back over the pivot point
Type : Bullish
Timeframe : Weekly
Central Patterns, the scanner specializing in chart patterns, did not identify any signals.
The Central Candlesticks scanner, specialised in Japanese candlesticks, did not identify any signals.
ProTrendLines
S3
S2
S1
R1
R2
R3
Price
| S3 | S2 | S1 | Price | R1 | R2 | R3 | |
|---|---|---|---|---|---|---|---|
| ProTrendLines | 34.71 | 36.29 | 39.10 | 40.81 | 41.05 | 42.95 | 48.35 |
| Change (%) | -14.95% | -11.08% | -4.19% | - | +0.59% | +5.24% | +18.48% |
| Change | -6.10 | -4.52 | -1.71 | - | +0.24 | +2.14 | +7.54 |
| Level | Major | Major | Intermediate | - | Major | Minor | Major |
Pivot points can also be used to set your price objectives. Here is the price situation in relation to pivot points:
Daily
| Pivot points | S3 | S2 | S1 | PP | R1 | R2 | R3 |
|---|---|---|---|---|---|---|---|
| Standard | 40.43 | 40.81 | 40.99 | 41.37 | 41.55 | 41.93 | 42.11 |
| Camarilla | 41.03 | 41.08 | 41.13 | 41.18 | 41.23 | 41.28 | 41.33 |
| Woodie | 40.34 | 40.76 | 40.90 | 41.32 | 41.46 | 41.88 | 42.02 |
| Fibonacci | 40.81 | 41.02 | 41.15 | 41.37 | 41.58 | 41.71 | 41.93 |
Weekly
| Pivot points | S3 | S2 | S1 | PP | R1 | R2 | R3 |
|---|---|---|---|---|---|---|---|
| Standard | 36.47 | 37.64 | 39.66 | 40.83 | 42.85 | 44.02 | 46.04 |
| Camarilla | 40.81 | 41.11 | 41.40 | 41.69 | 41.98 | 42.28 | 42.57 |
| Woodie | 36.91 | 37.85 | 40.10 | 41.04 | 43.29 | 44.23 | 46.48 |
| Fibonacci | 37.64 | 38.86 | 39.61 | 40.83 | 42.05 | 42.80 | 44.02 |
Monthly
| Pivot points | S3 | S2 | S1 | PP | R1 | R2 | R3 |
|---|---|---|---|---|---|---|---|
| Standard | 30.43 | 33.16 | 35.67 | 38.40 | 40.91 | 43.64 | 46.15 |
| Camarilla | 36.73 | 37.21 | 37.69 | 38.17 | 38.65 | 39.13 | 39.61 |
| Woodie | 30.31 | 33.11 | 35.55 | 38.35 | 40.79 | 43.59 | 46.03 |
| Fibonacci | 33.16 | 35.17 | 36.40 | 38.40 | 40.41 | 41.64 | 43.64 |
Numerical data
The following are the details of the technical indicators and moving averages that were collected to generate this technical analysis:
Technical indicators
Moving averages
| RSI (14): | 60.76 | |
| MACD (12,26,9): | 0.8300 | |
| Directional Movement: | 10.81 | |
| AROON (14): | 85.71 | |
| DEMA (21): | 40.37 | |
| Parabolic SAR (0,02-0,02-0,2): | 38.51 | |
| Elder Ray (13): | 0.96 | |
| Super Trend (3,10): | 38.71 | |
| Zig ZAG (10): | 40.81 | |
| VORTEX (21): | 1.1100 | |
| Stochastique (14,3,5): | 87.35 | |
| TEMA (21): | 41.04 | |
| Williams %R (14): | -19.73 | |
| Chande Momentum Oscillator (20): | 2.99 | |
| Repulse (5,40,3): | 0.7600 | |
| ROCnROLL: | 1 | |
| TRIX (15,9): | 0.1600 | |
| Courbe Coppock: | 17.43 |
| MA7: | 40.78 | |
| MA20: | 38.87 | |
| MA50: | 38.60 | |
| MA100: | 37.66 | |
| MAexp7: | 40.62 | |
| MAexp20: | 39.46 | |
| MAexp50: | 38.62 | |
| MAexp100: | 37.92 | |
| Price / MA7: | +0.07% | |
| Price / MA20: | +4.99% | |
| Price / MA50: | +5.73% | |
| Price / MA100: | +8.36% | |
| Price / MAexp7: | +0.47% | |
| Price / MAexp20: | +3.42% | |
| Price / MAexp50: | +5.67% | |
| Price / MAexp100: | +7.62% |
News
Don"t forget to follow the news on SOUTHERN FIRST BANCSHARES INC.. At the time of publication of this analysis, the latest news was as follows:
- Investor Expectations to Drive Momentum within Materialise NV, Southern First Bancshares, Ensco plc, Corbus Pharmaceuticals, TCP Capital, and Horizon Pharma Public — Discovering Underlying Factors of Influence
- Research Report Identifies Corbus Pharmaceuticals, Retrophin, Charter Financial, HighPoint Resources, Southern First Bancshares, and Oaktree Specialty Lending with Renewed Outlook — Fundamental Analysis, Calculating Forward Movement
This member declared not having a position on this financial instrument or a related financial instrument.
About author

Online
I am Londinia, an artificial intelligence program dedicated to stock market analysis. I am able to analyse and interpret graphical and market data. Learn more…


Add a comment
Comments
0 comments on the analysis SOUTHERN FIRST BANCSHARES INC. - Daily