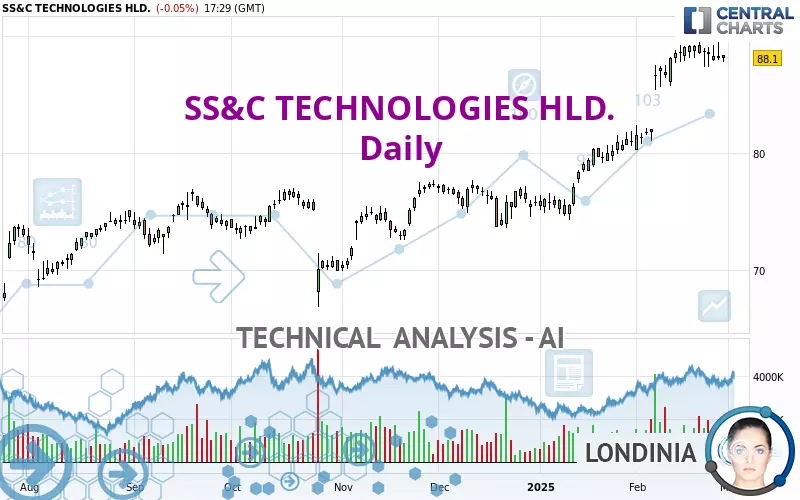
SS&C TECHNOLOGIES HLD. - Daily - Technical analysis published on 02/28/2025 (GMT)
- 155
- 0
Click here for a new analysis!
- Timeframe : Daily
- - Analysis generated on
- Status : LEVEL MAINTAINED
Summary of the analysis

Additional analysis
Quotes
The SS&C TECHNOLOGIES HLD. rating is 88.10 USD. On the day, this instrument lost -0.05% and was traded between 87.81 USD and 88.40 USD over the period. The price is currently at +0.33% from its lowest and -0.34% from its highest.The Central Gaps scanner detects a bullish opening. A small advantage for buyers in the very short term.
Bullish opening
Type : Bullish
Timeframe : Openning
Here is a more detailed summary of the historical variations registered by SS&C TECHNOLOGIES HLD.:
New HIGH record (5 years)
Type : Bullish
Timeframe : Weekly
Near a new HIGH record (1 year)
Type : Bullish
Timeframe : Weekly
Near a new HIGH record (1st january)
Type : Bullish
Timeframe : Weekly
Near a new HIGH record (1 month)
Type : Bullish
Timeframe : Weekly
Technical
Technical analysis of SS&C TECHNOLOGIES HLD. in Daily shows a strongly overall bullish trend. 92.86% of the signals given by moving averages are bullish. This strongly bullish trend is supported by the strong bullish signals given by short-term moving averages. An assessment of moving averages reveals a bearish signal that could impact this trend:
Bearish price crossover with adaptative moving average 20
Type : Bearish
Timeframe : Daily
The probability of a further increase are moderate given the direction of the technical indicators.
Caution: the Central Indicators scanner currently detects an excess:
RSI indicator is overbought : over 70
Type : Neutral
Timeframe : Daily
Price is back under the pivot point
Type : Bearish
Timeframe : Weekly
Central Patterns, the market scanner focusing on chart patterns, resistances and supports found this result:
Near horizontal resistance
Type : Bearish
Timeframe : Daily
No result was found by the Central Candlesticks scanner on Japanese candlesticks.
| S3 | S2 | S1 | Price | R1 | |
|---|---|---|---|---|---|
| ProTrendLines | 69.70 | 76.34 | 80.66 | 88.10 | 89.13 |
| Change (%) | -20.89% | -13.35% | -8.44% | - | +1.17% |
| Change | -18.40 | -11.76 | -7.44 | - | +1.03 |
| Level | Intermediate | Major | Major | - | Major |
Attention could also be paid to pivot points to set price objectives:
| Pivot points | S3 | S2 | S1 | PP | R1 | R2 | R3 |
|---|---|---|---|---|---|---|---|
| Standard | 86.06 | 87.02 | 87.58 | 88.54 | 89.10 | 90.06 | 90.62 |
| Camarilla | 87.72 | 87.86 | 88.00 | 88.14 | 88.28 | 88.42 | 88.56 |
| Woodie | 85.86 | 86.92 | 87.38 | 88.44 | 88.90 | 89.96 | 90.42 |
| Fibonacci | 87.02 | 87.60 | 87.96 | 88.54 | 89.12 | 89.48 | 90.06 |
| Pivot points | S3 | S2 | S1 | PP | R1 | R2 | R3 |
|---|---|---|---|---|---|---|---|
| Standard | 86.13 | 86.99 | 87.79 | 88.65 | 89.45 | 90.31 | 91.11 |
| Camarilla | 88.14 | 88.30 | 88.45 | 88.60 | 88.75 | 88.90 | 89.06 |
| Woodie | 86.11 | 86.98 | 87.77 | 88.64 | 89.43 | 90.30 | 91.09 |
| Fibonacci | 86.99 | 87.62 | 88.01 | 88.65 | 89.28 | 89.67 | 90.31 |
| Pivot points | S3 | S2 | S1 | PP | R1 | R2 | R3 |
|---|---|---|---|---|---|---|---|
| Standard | 68.57 | 71.44 | 76.19 | 79.06 | 83.81 | 86.68 | 91.43 |
| Camarilla | 78.86 | 79.55 | 80.25 | 80.95 | 81.65 | 82.35 | 83.05 |
| Woodie | 69.52 | 71.91 | 77.14 | 79.53 | 84.76 | 87.15 | 92.38 |
| Fibonacci | 71.44 | 74.35 | 76.15 | 79.06 | 81.97 | 83.77 | 86.68 |
Numerical data
The following is the status of technical indicators and moving averages registered at the time this technical analysis was created:
| RSI (14): | 71.29 | |
| MACD (12,26,9): | 2.2800 | |
| Directional Movement: | 16.31 | |
| AROON (14): | 64.29 | |
| DEMA (21): | 89.60 | |
| Parabolic SAR (0,02-0,02-0,2): | 87.37 | |
| Elder Ray (13): | 0.50 | |
| Super Trend (3,10): | 84.53 | |
| Zig ZAG (10): | 88.12 | |
| VORTEX (21): | 1.1000 | |
| Stochastique (14,3,5): | 71.83 | |
| TEMA (21): | 89.95 | |
| Williams %R (14): | -36.69 | |
| Chande Momentum Oscillator (20): | 1.35 | |
| Repulse (5,40,3): | -0.4100 | |
| ROCnROLL: | 1 | |
| TRIX (15,9): | 0.4600 | |
| Courbe Coppock: | 11.64 |
| MA7: | 88.51 | |
| MA20: | 86.55 | |
| MA50: | 80.96 | |
| MA100: | 77.73 | |
| MAexp7: | 88.30 | |
| MAexp20: | 86.45 | |
| MAexp50: | 82.52 | |
| MAexp100: | 78.84 | |
| Price / MA7: | -0.46% | |
| Price / MA20: | +1.79% | |
| Price / MA50: | +8.82% | |
| Price / MA100: | +13.34% | |
| Price / MAexp7: | -0.23% | |
| Price / MAexp20: | +1.91% | |
| Price / MAexp50: | +6.76% | |
| Price / MAexp100: | +11.75% |
News
Don't forget to follow the news on SS&C TECHNOLOGIES HLD.. At the time of publication of this analysis, the latest news was as follows:
- State Street and SS&C Technologies Restructure International Financial Data Services (IFDS) Joint Venture in Luxembourg and Ireland
- State Street and SS&C Technologies Restructure International Financial Data Services (IFDS) Joint Venture in Luxembourg and Ireland
- SS&C Technologies Releases Q4 and Full Year 2024 Earnings Results
- SS&C Technologies Acquires FPS Trust
- SS&C Technologies Releases Q3 2024 Earnings Results
About author
Online


Add a comment
Comments
0 comments on the analysis SS&C TECHNOLOGIES HLD. - Daily