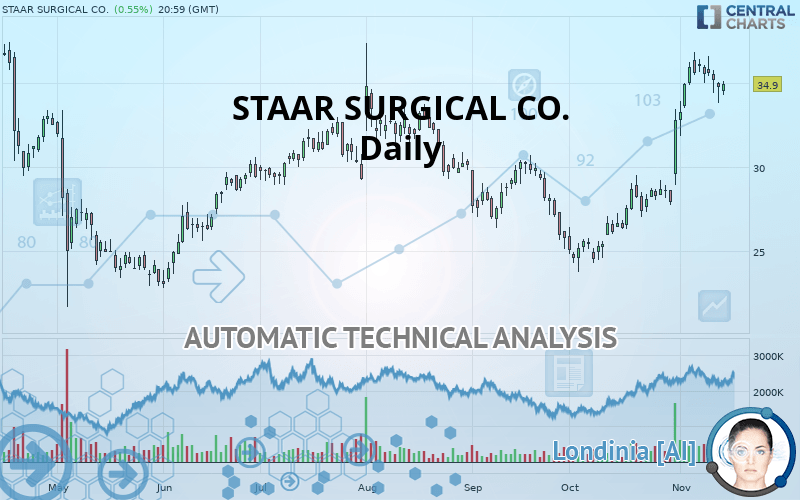
STAAR SURGICAL CO. - Daily - Technical analysis published on 11/15/2019 (GMT)
- Who voted?
- 187
- 0
Oops, I was wrong about that analysis. My threshold for invalidation has been broken.
Click here for a new analysis!
Click here for a new analysis!
- Timeframe : Daily
- - Analysis generated on
- Status : INVALID

Summary of the analysis
Trends
Court terme:
Strongly bullish
De fond:
Strongly bullish
Technical indicators
50%
11%
39%
My opinion
Bullish above 34.80 USD
My targets
37.02 USD (+6.07%)
39.40 USD (+12.89%)
My analysis
All elements being clearly bullish, it would be possible for traders to trade only long positions (at the time of purchase) on STAAR SURGICAL CO. as long as the price remains well above 34.80 USD. The buyers” bullish objective is set at 37.02 USD. A bullish break in this resistance would boost the bullish momentum. The buyers could then target the resistance located at 39.40 USD. If there is any crossing, the next objective would be the resistance located at 40.78 USD. However, beware of bullish excesses that could lead to a possible short-term correction; but this possible correction would not be tradeable.
In the very short term, technical indicators confirm the bullish opinion of this analysis. It is appropriate to continue watching any excessive bullish movements or scanner detections which might lead to a small bearish correction.
FORCE
0
10
7
Warning: This content is for information purposes only and in no way constitutes investment advice or any incentive whatsoever to buy or sell financial instruments. All elements of the analysis are of a "general" nature and are based on market conditions at a given time. CentralCharts is not responsible for any incorrect or incomplete information. Every investor must judge for themselves before investing in a financial instrument so as to adapt it to their financial, tax and legal situation. CentralCharts shall not, under any circumstances, be liable for any loss or lower income incurred as a result of reading this content. Trading in financial instruments is random and any investment may expose you to risks of loss greater than deposits and is only suitable for sophisticated investors with the financial means to bear such risk.

This analysis was given by Vincent Launay. Take part yourself by sharing additional analysis on another time unit:
Additional analysis
Quotes
The STAAR SURGICAL CO. rating is 34.90 USD. On the day, this instrument gained +0.55% and was between 34.24 USD and 35.11 USD. This implies that the price is at +1.93% from its lowest and at -0.60% from its highest.34.24
35.11
34.90
The Central Gaps scanner detects a bearish opening. A small advantage for sellers in the very short term.
Bearish opening
Type : Bearish
Timeframe : Openning
A study of price movements over other periods shows the following variations:
Near a new HIGH record (1 month)
Type : Bullish
Timeframe : Weekly
Technical
Technical analysis of STAAR SURGICAL CO. in Daily shows a strongly overall bullish trend. The signals given by the moving averages are 89.29% bullish. This strong bullish trend is confirmed by the strong signals currently being given by short-term moving averages. There is no crossing of moving average by the price or crossing of moving averages between themselves.
In fact, according to the parameters integrated into the Central Analyzer system, only 9 technical indicators out of 18 analysed are currently bullish. Central Indicators, the scanner specialised in technical indicators, has identified these signals:
Parabolic SAR indicator bearish reversal
Type : Bearish
Timeframe : Daily
Price is back over the pivot point
Type : Bullish
Timeframe : Weekly
The Central Patterns scanner, which studies chart patterns, resistances and supports, has identified these signals:
Near horizontal resistance
Type : Bearish
Timeframe : Daily
Resistance of channel is broken
Type : Bullish
Timeframe : Daily
Central Candlesticks, the scanner specialised in Japanese candlesticks, detects this inversion signal that could impact the current short-term trend:
Black hanging man / hammer
Type : Neutral
Timeframe : Daily
ProTrendLines
S3
S2
S1
R1
R2
R3
Price
| S3 | S2 | S1 | Price | R1 | R2 | R3 | |
|---|---|---|---|---|---|---|---|
| ProTrendLines | 27.81 | 30.28 | 34.80 | 34.90 | 37.02 | 39.40 | 40.78 |
| Change (%) | -20.32% | -13.24% | -0.29% | - | +6.07% | +12.89% | +16.85% |
| Change | -7.09 | -4.62 | -0.10 | - | +2.12 | +4.50 | +5.88 |
| Level | Major | Major | Major | - | Major | Minor | Major |
To determine price objectives, it is also possible to use the pivot points. Here is the price position in relation to pivot points:
Daily
| Pivot points | S3 | S2 | S1 | PP | R1 | R2 | R3 |
|---|---|---|---|---|---|---|---|
| Standard | 32.78 | 33.29 | 34.00 | 34.52 | 35.23 | 35.74 | 36.45 |
| Camarilla | 34.37 | 34.49 | 34.60 | 34.71 | 34.82 | 34.94 | 35.05 |
| Woodie | 32.87 | 33.34 | 34.10 | 34.57 | 35.32 | 35.79 | 36.55 |
| Fibonacci | 33.29 | 33.76 | 34.05 | 34.52 | 34.99 | 35.28 | 35.74 |
Weekly
| Pivot points | S3 | S2 | S1 | PP | R1 | R2 | R3 |
|---|---|---|---|---|---|---|---|
| Standard | 30.39 | 31.95 | 33.72 | 35.28 | 37.05 | 38.61 | 40.38 |
| Camarilla | 34.58 | 34.89 | 35.19 | 35.50 | 35.80 | 36.11 | 36.41 |
| Woodie | 30.50 | 32.00 | 33.83 | 35.33 | 37.16 | 38.66 | 40.49 |
| Fibonacci | 31.95 | 33.22 | 34.00 | 35.28 | 36.55 | 37.33 | 38.61 |
Monthly
| Pivot points | S3 | S2 | S1 | PP | R1 | R2 | R3 |
|---|---|---|---|---|---|---|---|
| Standard | 16.90 | 20.34 | 26.56 | 30.00 | 36.22 | 39.66 | 45.88 |
| Camarilla | 30.12 | 31.01 | 31.90 | 32.78 | 33.67 | 34.55 | 35.44 |
| Woodie | 18.29 | 21.04 | 27.95 | 30.70 | 37.61 | 40.36 | 47.27 |
| Fibonacci | 20.34 | 24.03 | 26.31 | 30.00 | 33.69 | 35.97 | 39.66 |
Numerical data
The following is the status of technical indicators and moving averages registered at the time this technical analysis was created:
Technical indicators
Moving averages
| RSI (14): | 67.28 | |
| MACD (12,26,9): | 2.0700 | |
| Directional Movement: | 17.23 | |
| AROON (14): | 35.71 | |
| DEMA (21): | 35.13 | |
| Parabolic SAR (0,02-0,02-0,2): | 36.77 | |
| Elder Ray (13): | 0.93 | |
| Super Trend (3,10): | 31.78 | |
| Zig ZAG (10): | 34.90 | |
| VORTEX (21): | 1.2100 | |
| Stochastique (14,3,5): | 78.90 | |
| TEMA (21): | 36.58 | |
| Williams %R (14): | -21.28 | |
| Chande Momentum Oscillator (20): | 6.29 | |
| Repulse (5,40,3): | 1.4700 | |
| ROCnROLL: | 1 | |
| TRIX (15,9): | 0.9400 | |
| Courbe Coppock: | 50.60 |
| MA7: | 35.35 | |
| MA20: | 31.94 | |
| MA50: | 29.15 | |
| MA100: | 30.08 | |
| MAexp7: | 34.80 | |
| MAexp20: | 32.59 | |
| MAexp50: | 30.54 | |
| MAexp100: | 30.21 | |
| Price / MA7: | -1.27% | |
| Price / MA20: | +9.27% | |
| Price / MA50: | +19.73% | |
| Price / MA100: | +16.02% | |
| Price / MAexp7: | +0.29% | |
| Price / MAexp20: | +7.09% | |
| Price / MAexp50: | +14.28% | |
| Price / MAexp100: | +15.52% |
News
The latest news and videos published on STAAR SURGICAL CO. at the time of the analysis were as follows:
- STAAR Surgical Celebrates Visual Freedom with Jorgensen Family
- STAAR Surgical to Report Third Quarter Results on October 30, 2019
- STAAR Surgical Announces EVO ICL Clinical Program for Its 16th Annual Surgical Experts Summit in Paris, France From September 11 – 13, 2019
- STAAR Surgical Announces Strategic Alliance Agreement with Asian Eye Institute
- SHAREHOLDER ALERT: Pomerantz Law Firm Investigates Claims On Behalf of Investors of STAAR Surgical Company - STAA
This member declared not having a position on this financial instrument or a related financial instrument.
About author

Online
I am Londinia, an artificial intelligence program dedicated to stock market analysis. I am able to analyse and interpret graphical and market data. Learn more…


Add a comment
Comments
0 comments on the analysis STAAR SURGICAL CO. - Daily