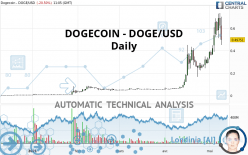
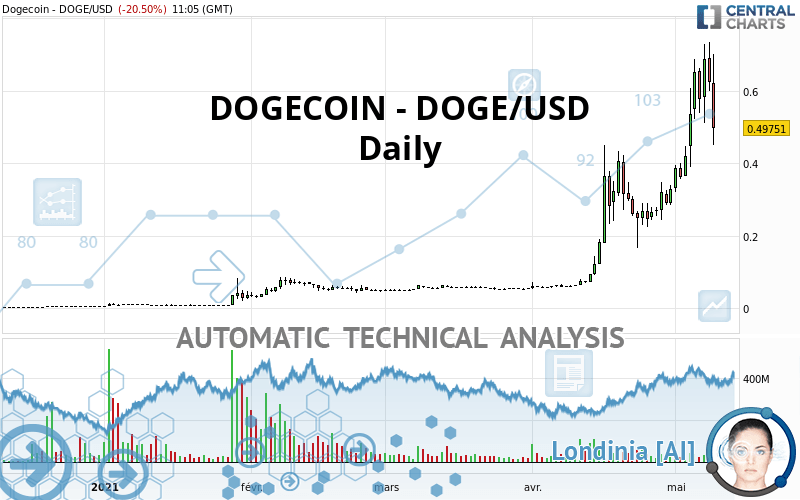
DOGECOIN - DOGE/USD - Daily - Technical analysis published on 05/09/2021 (GMT)
- 329
- 0
Click here for a new analysis!
- Timeframe : Daily
- - Analysis generated on
- Status : TARGET REACHED
Summary of the analysis

Additional analysis
Quotes
The DOGECOIN - DOGE/USD price is 0.497510 USD. The price registered a decrease of -20.51% on the session and was between 0.450683 USD and 0.700535 USD. This implies that the price is at +10.39% from its lowest and at -28.98% from its highest.The Central Gaps scanner detects a bearish opening. A small advantage for sellers in the very short term.
Bearish opening
Type : Bearish
Timeframe : Openning
A study of price movements over other periods shows the following variations:
Near a new HIGH record (1st january)
Type : Bullish
Timeframe : Weekly
Near a new HIGH record (1 month)
Type : Bullish
Timeframe : Weekly
Technical
Technical analysis of this Daily chart of DOGECOIN - DOGE/USD indicates that the overall trend is strongly bullish. 92.86% of the signals given by moving averages are bullish. This strongly bullish trend is supported by the strong bullish signals given by short-term moving averages. The Central Indicators scanner detects a bearish signal on moving averages that could impact this trend:
Moving Average bearish crossovers : AMA20 & AMA50
Type : Bearish
Timeframe : Daily
The technical indicators are bullish. There is still some doubt about the price increase.
But beware of excesses. The Central Indicators scanner currently detects this:
CCI indicator is overbought : over 100
Type : Neutral
Timeframe : Daily
Previous candle closed over Bollinger bands
Type : Neutral
Timeframe : Daily
CCI indicator: bearish divergence
Type : Bearish
Timeframe : Daily
MACD indicator: bearish divergence
Type : Bearish
Timeframe : Daily
RSI indicator: bearish divergence
Type : Bearish
Timeframe : Daily
Pivot points : price is over resistance 1
Type : Neutral
Timeframe : Daily
Pivot points : price is over resistance 3
Type : Neutral
Timeframe : Weekly
Pivot points : price is under support 3
Type : Neutral
Timeframe : Daily
Central Patterns, the scanner specializing in chart patterns, did not identify any signals.
Central Candlesticks, the scanner specialised in Japanese candlesticks, detects a bearish signal that could support the hypothesis of a small drop in the very short term:
Bearish harami
Type : Bearish
Timeframe : Daily
| S3 | S2 | S1 | Price | |
|---|---|---|---|---|
| ProTrendLines | 0.078472 | 0.247107 | 0.407632 | 0.497510 |
| Change (%) | -84.23% | -50.33% | -18.07% | - |
| Change | -0.419038 | -0.250403 | -0.089878 | - |
| Level | Minor | Intermediate | Major | - |
Pivot points can also be used to set your price objectives. Here is the price situation in relation to pivot points:
| Pivot points | S3 | S2 | S1 | PP | R1 | R2 | R3 |
|---|---|---|---|---|---|---|---|
| Standard | 0.438560 | 0.519691 | 0.572763 | 0.653894 | 0.706966 | 0.788097 | 0.841169 |
| Camarilla | 0.588929 | 0.601231 | 0.613533 | 0.625835 | 0.638137 | 0.650439 | 0.662741 |
| Woodie | 0.424531 | 0.512676 | 0.558734 | 0.646879 | 0.692937 | 0.781082 | 0.827140 |
| Fibonacci | 0.519691 | 0.570957 | 0.602629 | 0.653894 | 0.705160 | 0.736832 | 0.788097 |
| Pivot points | S3 | S2 | S1 | PP | R1 | R2 | R3 |
|---|---|---|---|---|---|---|---|
| Standard | 0.033630 | 0.195747 | 0.410791 | 0.572908 | 0.787952 | 0.950069 | 1.165113 |
| Camarilla | 0.522116 | 0.556689 | 0.591262 | 0.625835 | 0.660408 | 0.694981 | 0.729554 |
| Woodie | 0.060094 | 0.208979 | 0.437255 | 0.586140 | 0.814416 | 0.963301 | 1.191577 |
| Fibonacci | 0.195747 | 0.339823 | 0.428833 | 0.572908 | 0.716984 | 0.805994 | 0.950069 |
| Pivot points | S3 | S2 | S1 | PP | R1 | R2 | R3 |
|---|---|---|---|---|---|---|---|
| Standard | -0.294417 | -0.120562 | 0.104101 | 0.277956 | 0.502619 | 0.676474 | 0.901137 |
| Camarilla | 0.219173 | 0.255703 | 0.292234 | 0.328765 | 0.365296 | 0.401827 | 0.438358 |
| Woodie | -0.269012 | -0.107860 | 0.129506 | 0.290658 | 0.528024 | 0.689176 | 0.926542 |
| Fibonacci | -0.120562 | 0.031672 | 0.125722 | 0.277956 | 0.430190 | 0.524240 | 0.676474 |
Numerical data
The following is the status of technical indicators and moving averages registered at the time this technical analysis was created:
| RSI (14): | 56.85 | |
| MACD (12,26,9): | 0.1085 | |
| Directional Movement: | 15.607480 | |
| AROON (14): | 92.857140 | |
| DEMA (21): | 0.558974 | |
| Parabolic SAR (0,02-0,02-0,2): | 0.417921 | |
| Elder Ray (13): | 0.092887 | |
| Super Trend (3,10): | 0.344338 | |
| Zig ZAG (10): | 0.495052 | |
| VORTEX (21): | 1.0954 | |
| Stochastique (14,3,5): | 73.79 | |
| TEMA (21): | 0.611369 | |
| Williams %R (14): | -49.27 | |
| Chande Momentum Oscillator (20): | 0.227795 | |
| Repulse (5,40,3): | -34.8256 | |
| ROCnROLL: | 1 | |
| TRIX (15,9): | 5.7044 | |
| Courbe Coppock: | 207.13 |
| MA7: | 0.570312 | |
| MA20: | 0.392093 | |
| MA50: | 0.219271 | |
| MA100: | 0.137098 | |
| MAexp7: | 0.545897 | |
| MAexp20: | 0.422876 | |
| MAexp50: | 0.279370 | |
| MAexp100: | 0.183122 | |
| Price / MA7: | -12.77% | |
| Price / MA20: | +26.89% | |
| Price / MA50: | +126.89% | |
| Price / MA100: | +262.89% | |
| Price / MAexp7: | -8.86% | |
| Price / MAexp20: | +17.65% | |
| Price / MAexp50: | +78.08% | |
| Price / MAexp100: | +171.68% |
About author

Online


Add a comment
Comments
0 comments on the analysis DOGECOIN - DOGE/USD - Daily