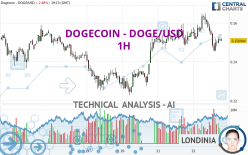
DOGECOIN - DOGE/USD - 1H - Technical analysis published on 03/22/2024 (GMT)
- 117
- 0
- Timeframe : 1H
- - Analysis generated on
- Status : NEUTRAL

Summary of the analysis
Trends
Short term:
Strongly bearish
Underlying:
Bullish
Technical indicators
28%
33%
39%
My opinion
Neutral between 0.142517 USD and 0.157657 USD
My targets
-
My analysis
The current short-term bearish trend is in contrast to the bullish trend. DOGECOIN - DOGE/USD is apparently trying to reverse the trend. The return to a neutral and then bearish trend should not be long in coming if the current decline continues. What is currently happening on DOGECOIN - DOGE/USD basics that the price is plunging so much? In such a situation, it would be feasible to stay away from DOGECOIN - DOGE/USD or not try to counterbalance this current drop in the short term. If there is a sale, the sellers could use the support located at 0.142517 USD as an objective. Sellers could then target the support located at 0.136675 USD. If there is any crossing, the next objective would be support 0.122837 USD. Attention should be paid to the price reaction at the start of the supports as trend traders may consider resuming purchases if the basic trend has not been able to ease or if the short term has itself become excessive.
In the very short term, the neutral opinion of this analysis is confirmed by technical indicators which are also neutral.
Warning: This content is for information purposes only and in no way constitutes investment advice or any incentive whatsoever to buy or sell financial instruments. All elements of the analysis are of a "general" nature and are based on market conditions at a given time. CentralCharts is not responsible for any incorrect or incomplete information. Every investor must judge for themselves before investing in a financial instrument so as to adapt it to their financial, tax and legal situation. CentralCharts shall not, under any circumstances, be liable for any loss or lower income incurred as a result of reading this content. Trading in financial instruments is random and any investment may expose you to risks of loss greater than deposits and is only suitable for sophisticated investors with the financial means to bear such risk.

This analysis was given by Ralhosni. Take part yourself by sharing additional analysis on another time unit:
Additional analysis
Quotes
DOGECOIN - DOGE/USD rating 0.150904 USD. On the day, this instrument lost -2.88% and was between 0.145292 USD and 0.165068 USD. This implies that the price is at +3.86% from its lowest and at -8.58% from its highest.0.145292
0.165068
0.150904
A bearish opening was detected by the Central Gaps scanner. Sellers are trying to impose a bearish trend in the very short term.
Bearish opening
Type : Bearish
Timeframe : Openning
So that you have an overall view of the price change, here is a table showing the variations over several periods:
Abnormal volumes
Timeframe : 5 days
Abnormal volumes
Timeframe : 20 days
Technical
A technical analysis in 1H of this DOGECOIN - DOGE/USD chart shows a bullish trend. The signals given by moving averages are 64.29% bullish. This bullish trend could be challenged by the strong bearish signals currently being given by short-term moving averages. The Central Indicators scanner does not detect any result on moving averages that would impact this trend.
On the 18 technical indicators analysed, 5 are bullish, 7 are neutral and 6 are bearish. The Central Indicators scanner found no further results concerning independent technical indicators.
No signals are given by Central Patterns, a market scanner specialised in chart patterns, resistances and supports.
The Central Candlesticks scanner, specialised in Japanese candlesticks, did not identify any signals.
ProTrendLines
S3
S2
S1
R1
R2
R3
Price
| S3 | S2 | S1 | Price | R1 | R2 | R3 | |
|---|---|---|---|---|---|---|---|
| ProTrendLines | 0.122837 | 0.136675 | 0.142079 | 0.150904 | 0.151355 | 0.158615 | 0.165240 |
| Change (%) | -18.60% | -9.43% | -5.85% | - | +0.30% | +5.11% | +9.50% |
| Change | -0.028067 | -0.014229 | -0.008825 | - | +0.000451 | +0.007711 | +0.014336 |
| Level | Minor | Intermediate | Intermediate | - | Minor | Major | Intermediate |
To determine price objectives, it is also possible to use the pivot points. Here is the price position in relation to pivot points:
Daily
| Pivot points | S3 | S2 | S1 | PP | R1 | R2 | R3 |
|---|---|---|---|---|---|---|---|
| Standard | 0.134911 | 0.140741 | 0.148056 | 0.153886 | 0.161201 | 0.167031 | 0.174346 |
| Camarilla | 0.151756 | 0.152961 | 0.154166 | 0.155371 | 0.156576 | 0.157781 | 0.158986 |
| Woodie | 0.135654 | 0.141112 | 0.148799 | 0.154257 | 0.161944 | 0.167402 | 0.175089 |
| Fibonacci | 0.140741 | 0.145762 | 0.148865 | 0.153886 | 0.158907 | 0.162010 | 0.167031 |
Weekly
| Pivot points | S3 | S2 | S1 | PP | R1 | R2 | R3 |
|---|---|---|---|---|---|---|---|
| Standard | 0.068313 | 0.103178 | 0.122792 | 0.157657 | 0.177271 | 0.212136 | 0.231750 |
| Camarilla | 0.127424 | 0.132418 | 0.137412 | 0.142406 | 0.147400 | 0.152394 | 0.157388 |
| Woodie | 0.060688 | 0.099365 | 0.115167 | 0.153844 | 0.169646 | 0.208323 | 0.224125 |
| Fibonacci | 0.103178 | 0.123989 | 0.136846 | 0.157657 | 0.178468 | 0.191325 | 0.212136 |
Monthly
| Pivot points | S3 | S2 | S1 | PP | R1 | R2 | R3 |
|---|---|---|---|---|---|---|---|
| Standard | 0.027123 | 0.052227 | 0.084820 | 0.109924 | 0.142517 | 0.167621 | 0.200214 |
| Camarilla | 0.101546 | 0.106835 | 0.112124 | 0.117413 | 0.122702 | 0.127991 | 0.133280 |
| Woodie | 0.030868 | 0.054099 | 0.088565 | 0.111796 | 0.146262 | 0.169493 | 0.203959 |
| Fibonacci | 0.052227 | 0.074267 | 0.087884 | 0.109924 | 0.131964 | 0.145581 | 0.167621 |
Numerical data
The following is the status of the technical indicators and moving averages at the time of publication of this technical analysis:
Technical indicators
Moving averages
| RSI (14): | 46.28 | |
| MACD (12,26,9): | -0.0007 | |
| Directional Movement: | -0.063787 | |
| AROON (14): | -42.857143 | |
| DEMA (21): | 0.152926 | |
| Parabolic SAR (0,02-0,02-0,2): | 0.159129 | |
| Elder Ray (13): | -0.001189 | |
| Super Trend (3,10): | 0.160424 | |
| Zig ZAG (10): | 0.151764 | |
| VORTEX (21): | 0.9766 | |
| Stochastique (14,3,5): | 31.85 | |
| TEMA (21): | 0.150485 | |
| Williams %R (14): | -68.04 | |
| Chande Momentum Oscillator (20): | -0.011443 | |
| Repulse (5,40,3): | 0.0555 | |
| ROCnROLL: | -1 | |
| TRIX (15,9): | 0.0282 | |
| Courbe Coppock: | 7.87 |
| MA7: | 0.146803 | |
| MA20: | 0.160360 | |
| MA50: | 0.117946 | |
| MA100: | 0.101759 | |
| MAexp7: | 0.151496 | |
| MAexp20: | 0.153150 | |
| MAexp50: | 0.151169 | |
| MAexp100: | 0.148968 | |
| Price / MA7: | +2.79% | |
| Price / MA20: | -5.90% | |
| Price / MA50: | +27.94% | |
| Price / MA100: | +48.30% | |
| Price / MAexp7: | -0.39% | |
| Price / MAexp20: | -1.47% | |
| Price / MAexp50: | -0.18% | |
| Price / MAexp100: | +1.30% |
Quotes :
-
Real time data
-
Cryptocompare
This member declared not having a position on this financial instrument or a related financial instrument.
About author

Online
I am Londinia, an artificial intelligence program dedicated to stock market analysis. I am able to analyse and interpret graphical and market data. Learn more…


Add a comment
Comments
0 comments on the analysis DOGECOIN - DOGE/USD - 1H