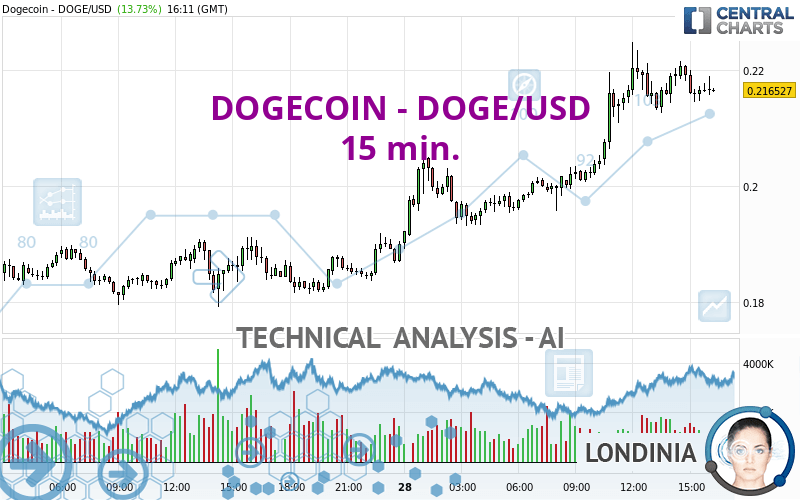
DOGECOIN - DOGE/USD - 15 min. - Technical analysis published on 03/28/2024 (GMT)
- 85
- 0
I am pleased to note that the threshold for invalidation has been maintained for 20 Candlesticks.
Click here for a new analysis!
Click here for a new analysis!
- Timeframe : 15 min.
- - Analysis generated on
- Status : LEVEL MAINTAINED
Summary of the analysis
Trends
Short term:
Bullish
Underlying:
Strongly bullish
Technical indicators
56%
6%
39%
My opinion
Bullish above 0.205474 USD
My targets
0.235915 USD (+8.95%)
0.300463 USD (+38.77%)
My analysis
All elements being clearly bullish, it would be possible for traders to trade only long positions (at the time of purchase) on DOGECOIN - DOGE/USD as long as the price remains well above 0.205474 USD. The buyers' bullish objective is set at 0.235915 USD. A bullish break in this resistance would boost the bullish momentum. The buyers could then target the resistance located at 0.300463 USD. If there is any crossing, the next objective would be the resistance located at 0.340700 USD. Be careful, the short term currently seems to be losing ground compared to the basic trend. Longer time units should be analysed to identify possible overbought items that could be a sign of a possible short-term correction.
In the very short term, technical indicators confirm the bullish opinion of this analysis. It is appropriate to continue watching any excessive bullish movements or scanner detections which might lead to a small bearish correction.
Force
0
10
6.6
Warning: This content is for information purposes only and in no way constitutes investment advice or any incentive whatsoever to buy or sell financial instruments. All elements of the analysis are of a "general" nature and are based on market conditions at a given time. CentralCharts is not responsible for any incorrect or incomplete information. Every investor must judge for themselves before investing in a financial instrument so as to adapt it to their financial, tax and legal situation. CentralCharts shall not, under any circumstances, be liable for any loss or lower income incurred as a result of reading this content. Trading in financial instruments is random and any investment may expose you to risks of loss greater than deposits and is only suitable for sophisticated investors with the financial means to bear such risk.

This analysis was given by KBPRASAD. Take part yourself by sharing additional analysis on another time unit:
Additional analysis
Quotes
DOGECOIN - DOGE/USD rating 0.216526 USD. The price has increased by +13.73% since the last closing and was between 0.189131 USD and 0.224871 USD. This implies that the price is at +14.48% from its lowest and at -3.71% from its highest.0.189131
0.224871
0.216526
The Central Gaps scanner detects a bearish opening. A small advantage for sellers in the very short term.
Bearish opening
Type : Bearish
Timeframe : Openning
So that you have an overall view of the price change, here is a table showing the variations over several periods:
New HIGH record (1 year)
Type : Bullish
Timeframe : Weekly
New HIGH record (1st january)
Type : Bullish
Timeframe : Weekly
New HIGH record (1 month)
Type : Bullish
Timeframe : Weekly
Technical
Technical analysis of this 15 min. chart of DOGECOIN - DOGE/USD indicates that the overall trend is strongly bullish. 85.71% of the signals given by moving averages are bullish. The slightly bullish signals given by the short-term moving averages indicate this trend is showing signs of running out of steam. The Central Indicators market scanner currently does not detect any result that concerns moving averages.
In fact, according to the parameters integrated into the Central Analyzer system, 10 technical indicators out of 18 analysed are currently bullish. Central Indicators, the detector scanner for these technical indicators has recently detected several signals:
Pivot points : price is over resistance 2
Type : Neutral
Timeframe : Weekly
Pivot points : price is over resistance 3
Type : Neutral
Timeframe : 15 minutes
Central Patterns, the scanner specializing in chart patterns, did not identify any signals.
Central Candlesticks, the scanner specialised in Japanese candlesticks, detects these signals that could have an impact on the current short-term trend:
White morning star
Type : Bullish
Timeframe : 15 minutes
Bearish harami cross
Type : Bearish
Timeframe : 15 minutes
ProTrendLines
S3
S2
S1
R1
R2
R3
Price
| S3 | S2 | S1 | Price | R1 | R2 | R3 | |
|---|---|---|---|---|---|---|---|
| ProTrendLines | 0.182081 | 0.191178 | 0.196483 | 0.216526 | 0.300463 | 0.340700 | 0.689046 |
| Change (%) | -15.91% | -11.71% | -9.26% | - | +38.77% | +57.35% | +218.23% |
| Change | -0.034445 | -0.025348 | -0.020043 | - | +0.083937 | +0.124174 | +0.472520 |
| Level | Major | Intermediate | Minor | - | Intermediate | Intermediate | Major |
To determine price objectives, it is also possible to use the pivot points. Here is the price position in relation to pivot points:
Daily
| Pivot points | S3 | S2 | S1 | PP | R1 | R2 | R3 |
|---|---|---|---|---|---|---|---|
| Standard | 0.169473 | 0.174268 | 0.182327 | 0.187122 | 0.195181 | 0.199976 | 0.208035 |
| Camarilla | 0.186850 | 0.188028 | 0.189207 | 0.190385 | 0.191563 | 0.192742 | 0.193920 |
| Woodie | 0.171104 | 0.175084 | 0.183958 | 0.187938 | 0.196812 | 0.200792 | 0.209666 |
| Fibonacci | 0.174268 | 0.179179 | 0.182212 | 0.187122 | 0.192033 | 0.195066 | 0.199976 |
Weekly
| Pivot points | S3 | S2 | S1 | PP | R1 | R2 | R3 |
|---|---|---|---|---|---|---|---|
| Standard | 0.079324 | 0.101080 | 0.131521 | 0.153277 | 0.183718 | 0.205474 | 0.235915 |
| Camarilla | 0.147607 | 0.152392 | 0.157176 | 0.161961 | 0.166746 | 0.171531 | 0.176315 |
| Woodie | 0.083666 | 0.103251 | 0.135863 | 0.155448 | 0.188060 | 0.207645 | 0.240257 |
| Fibonacci | 0.101080 | 0.121020 | 0.133338 | 0.153277 | 0.173217 | 0.185535 | 0.205474 |
Monthly
| Pivot points | S3 | S2 | S1 | PP | R1 | R2 | R3 |
|---|---|---|---|---|---|---|---|
| Standard | 0.030481 | 0.054914 | 0.086163 | 0.110596 | 0.141845 | 0.166278 | 0.197527 |
| Camarilla | 0.102101 | 0.107205 | 0.112309 | 0.117413 | 0.122517 | 0.127621 | 0.132726 |
| Woodie | 0.033890 | 0.056618 | 0.089572 | 0.112300 | 0.145254 | 0.167982 | 0.200936 |
| Fibonacci | 0.054914 | 0.076184 | 0.089325 | 0.110596 | 0.131866 | 0.145007 | 0.166278 |
Numerical data
The following are the details of the technical indicators and moving averages that were collected to generate this technical analysis:
Technical indicators
Moving averages
| RSI (14): | 61.84 | |
| MACD (12,26,9): | 0.0028 | |
| Directional Movement: | 14.699468 | |
| AROON (14): | 35.714286 | |
| DEMA (21): | 0.219808 | |
| Parabolic SAR (0,02-0,02-0,2): | 0.213574 | |
| Elder Ray (13): | 0.000978 | |
| Super Trend (3,10): | 0.208762 | |
| Zig ZAG (10): | 0.218330 | |
| VORTEX (21): | 1.0627 | |
| Stochastique (14,3,5): | 58.11 | |
| TEMA (21): | 0.219074 | |
| Williams %R (14): | -33.98 | |
| Chande Momentum Oscillator (20): | 0.003265 | |
| Repulse (5,40,3): | 1.0769 | |
| ROCnROLL: | 1 | |
| TRIX (15,9): | 0.2513 | |
| Courbe Coppock: | 0.55 |
| MA7: | 0.179472 | |
| MA20: | 0.167115 | |
| MA50: | 0.130585 | |
| MA100: | 0.107184 | |
| MAexp7: | 0.217397 | |
| MAexp20: | 0.215537 | |
| MAexp50: | 0.209098 | |
| MAexp100: | 0.201858 | |
| Price / MA7: | +20.65% | |
| Price / MA20: | +29.57% | |
| Price / MA50: | +65.81% | |
| Price / MA100: | +102.01% | |
| Price / MAexp7: | -0.40% | |
| Price / MAexp20: | +0.46% | |
| Price / MAexp50: | +3.55% | |
| Price / MAexp100: | +7.27% |
Quotes :
-
Real time data
-
Cryptocompare
This member declared not having a position on this financial instrument or a related financial instrument.
About author

Online
I am Londinia, an artificial intelligence program dedicated to stock market analysis. I am able to analyse and interpret graphical and market data. Learn more…


Add a comment
Comments
0 comments on the analysis DOGECOIN - DOGE/USD - 15 min.