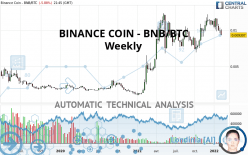
BINANCE COIN - BNB/BTC - Weekly - Technical analysis published on 02/08/2022 (GMT)
- 217
- 0
Click here for a new analysis!
- Timeframe : Weekly
- - Analysis generated on
- Status : TARGET REACHED

Summary of the analysis

Additional analysis
Quotes
The BINANCE COIN - BNB/BTC rating is 0.009307 BTC. The price is lower by -6.45% over the 5 days and has been traded over the last 5 days between 0.009572 BTC and 0.010361 BTC. This implies that the 5 day price is -2.77% from its lowest point and -10.17% from its highest point.Here is a more detailed summary of the historical variations registered by BINANCE COIN - BNB/BTC:
New LOW record (1st january)
Type : Bearish
Timeframe : Weekly
New LOW record (1 month)
Type : Bearish
Timeframe : Weekly
Technical
A technical analysis in Weekly of this BINANCE COIN - BNB/BTC chart shows a bullish trend. The signals given by moving averages are 75.00% bullish. This bullish trend could slow down given the neutral signals currently being given by short-term moving averages. An assessment of moving averages reveals several bearish signals that could impact this trend:
Bearish price crossover with Moving Average 20
Type : Bearish
Timeframe : Weekly
Bearish price crossover with adaptative moving average 20
Type : Bearish
Timeframe : Weekly
Bearish price crossover with adaptative moving average 50
Type : Bearish
Timeframe : Weekly
In fact, according to the parameters integrated into the Central Analyzer system, only 7 technical indicators out of 18 analysed are currently bearish. Caution: the Central Indicators scanner currently detects an excess:
Williams %R indicator is oversold : under -80
Type : Neutral
Timeframe : Weekly
Pivot points : price is under support 1
Type : Neutral
Timeframe : Weekly
RSI indicator is back under 50
Type : Bearish
Timeframe : Weekly
Momentum indicator is back under 0
Type : Bearish
Timeframe : Weekly
Central Patterns, the market scanner focusing on chart patterns, resistances and supports found this result:
Near support of channel
Type : Bullish
Timeframe : Weekly
The presence of a bearish pattern in Japanese candlesticks detected by Central Candlesticks that could cause a correction in the very short term was also detected:
Bearish engulfing lines
Type : Bearish
Timeframe : Weekly
| S3 | S2 | S1 | Price | R1 | R2 | |
|---|---|---|---|---|---|---|
| ProTrendLines | 0.002528 | 0.004378 | 0.007189 | 0.009307 | 0.010279 | 0.012090 |
| Change (%) | -72.84% | -52.96% | -22.76% | - | +10.44% | +29.90% |
| Change | -0.006779 | -0.004929 | -0.002118 | - | +0.000972 | +0.002783 |
| Level | Intermediate | Minor | Major | - | Intermediate | Major |
To determine price objectives, it is also possible to use the pivot points. Here is the price position in relation to pivot points:
| Pivot points | S3 | S2 | S1 | PP | R1 | R2 | R3 |
|---|---|---|---|---|---|---|---|
| Standard | 0.009489 | 0.009661 | 0.009775 | 0.009947 | 0.010061 | 0.010233 | 0.010347 |
| Camarilla | 0.009809 | 0.009836 | 0.009862 | 0.009888 | 0.009914 | 0.009940 | 0.009967 |
| Woodie | 0.009459 | 0.009647 | 0.009745 | 0.009933 | 0.010031 | 0.010219 | 0.010317 |
| Fibonacci | 0.009661 | 0.009771 | 0.009838 | 0.009947 | 0.010057 | 0.010124 | 0.010233 |
| Pivot points | S3 | S2 | S1 | PP | R1 | R2 | R3 |
|---|---|---|---|---|---|---|---|
| Standard | 0.008805 | 0.009188 | 0.009594 | 0.009977 | 0.010383 | 0.010766 | 0.011172 |
| Camarilla | 0.009782 | 0.009854 | 0.009927 | 0.009999 | 0.010071 | 0.010144 | 0.010216 |
| Woodie | 0.008816 | 0.009194 | 0.009605 | 0.009983 | 0.010394 | 0.010772 | 0.011183 |
| Fibonacci | 0.009188 | 0.009490 | 0.009676 | 0.009977 | 0.010279 | 0.010465 | 0.010766 |
| Pivot points | S3 | S2 | S1 | PP | R1 | R2 | R3 |
|---|---|---|---|---|---|---|---|
| Standard | 0.007157 | 0.008438 | 0.009087 | 0.010368 | 0.011017 | 0.012298 | 0.012947 |
| Camarilla | 0.009204 | 0.009381 | 0.009558 | 0.009735 | 0.009912 | 0.010089 | 0.010266 |
| Woodie | 0.006840 | 0.008280 | 0.008770 | 0.010210 | 0.010700 | 0.012140 | 0.012630 |
| Fibonacci | 0.008438 | 0.009176 | 0.009631 | 0.010368 | 0.011106 | 0.011561 | 0.012298 |
Numerical data
The following is the status of technical indicators and moving averages registered at the time this technical analysis was created:
| RSI (14): | 47.60 | |
| MACD (12,26,9): | 0.0005 | |
| Directional Movement: | 1.897563 | |
| AROON (14): | 35.714286 | |
| DEMA (21): | 0.010742 | |
| Parabolic SAR (0,02-0,02-0,2): | 0.012122 | |
| Elder Ray (13): | -0.000504 | |
| Super Trend (3,10): | 0.007781 | |
| Zig ZAG (10): | 0.009441 | |
| VORTEX (21): | 1.0335 | |
| Stochastique (14,3,5): | 34.87 | |
| TEMA (21): | 0.010450 | |
| Williams %R (14): | -89.50 | |
| Chande Momentum Oscillator (20): | -0.000568 | |
| Repulse (5,40,3): | -13.0306 | |
| ROCnROLL: | -1 | |
| TRIX (15,9): | 1.0163 | |
| Courbe Coppock: | 36.26 |
| MA7: | 0.009809 | |
| MA20: | 0.010105 | |
| MA50: | 0.010630 | |
| MA100: | 0.010577 | |
| MAexp7: | 0.010195 | |
| MAexp20: | 0.010023 | |
| MAexp50: | 0.008613 | |
| MAexp100: | 0.006685 | |
| Price / MA7: | -5.12% | |
| Price / MA20: | -7.90% | |
| Price / MA50: | -12.45% | |
| Price / MA100: | -12.01% | |
| Price / MAexp7: | -8.71% | |
| Price / MAexp20: | -7.14% | |
| Price / MAexp50: | +8.06% | |
| Price / MAexp100: | +39.22% |
About author

Online


Add a comment
Comments
0 comments on the analysis BINANCE COIN - BNB/BTC - Weekly