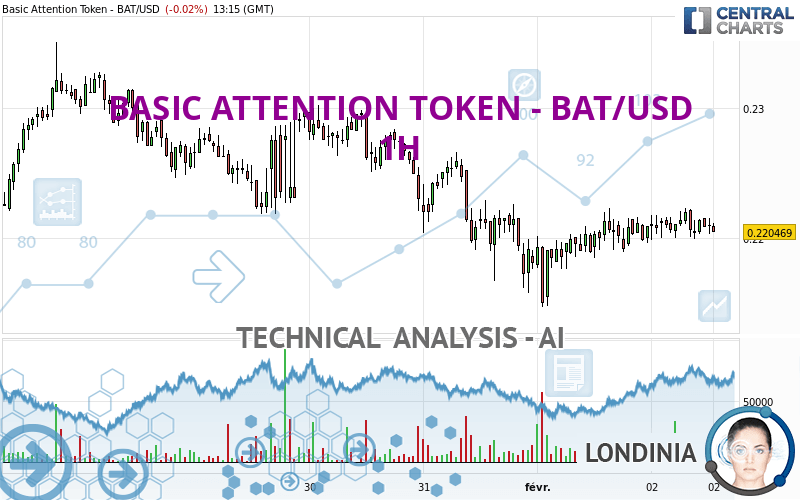
BASIC ATTENTION TOKEN - BAT/USD - 1H - Technical analysis published on 02/02/2024 (GMT)
- 99
- 0
I am pleased to note that the threshold for invalidation has been maintained for 20 Candlesticks.
Click here for a new analysis!
Click here for a new analysis!
- Timeframe : 1H
- - Analysis generated on
- Status : LEVEL MAINTAINED
Summary of the analysis
Trends
Short term:
Neutral
Underlying:
Bearish
Technical indicators
33%
33%
33%
My opinion
Bearish under 0.222224 USD
My targets
0.217569 USD (-1.32%)
0.214639 USD (-2.64%)
My analysis
Has the basic bearish trend slowed or is it lacking in power? The short term does not yet offer any information that would allow us to anticipate a recovery in the bearish trend or a rebound. Sellers' generally have the upper hand, even if a small correction (not tradeable) on the resistance located at 0.222224 USD remains possible. It is advisable to trade BASIC ATTENTION TOKEN - BAT/USD with the greatest caution, while favouring short positions (for sale) as long as the price remains well below 0.222224 USD. The next bearish objective for sellers is set at 0.217569 USD. A bearish break of this support would revive the bearish momentum. The sellers could then target the support located at 0.214639 USD. In case of crossing, the next objective would be the support located at 0.211123 USD. PS: if there is a bullish break in the resistance located at 0.222224 USD we suggest that you produce a new automated technical analysis. In fact, conditions should have changed. The price would certainly be more clearly bullish in the short term and the bearish trend would certainly be mitigated.
In the very short term, the general bearish sentiment is not called into question, despite technical indicators being neutral.
Force
0
10
3.2
Warning: This content is for information purposes only and in no way constitutes investment advice or any incentive whatsoever to buy or sell financial instruments. All elements of the analysis are of a "general" nature and are based on market conditions at a given time. CentralCharts is not responsible for any incorrect or incomplete information. Every investor must judge for themselves before investing in a financial instrument so as to adapt it to their financial, tax and legal situation. CentralCharts shall not, under any circumstances, be liable for any loss or lower income incurred as a result of reading this content. Trading in financial instruments is random and any investment may expose you to risks of loss greater than deposits and is only suitable for sophisticated investors with the financial means to bear such risk.

This analysis was given by Londinia. Take part yourself by sharing additional analysis on another time unit:
Additional analysis
Quotes
BASIC ATTENTION TOKEN - BAT/USD rating 0.220469 USD. The price registered a decrease of -0.02% on the session and was traded between 0.219859 USD and 0.222269 USD over the period. The price is currently at +0.28% from its lowest and -0.81% from its highest.0.219859
0.222269
0.220469
The Central Gaps scanner detects a bullish opening marking the presence of buyers ahead of sellers at the opening but not sufficiently marked to allow the price to register a quotation gap.
Bullish opening
Type : Bullish
Timeframe : Openning
A study of price movements over other periods shows the following variations:
Technical
Technical analysis of this 1H chart of BASIC ATTENTION TOKEN - BAT/USD indicates that the overall trend is bearish. 71.43% of the signals given by moving averages are bearish. Caution: the neutral signals currently given by short-term moving averages show us that the global trend is losing momentum. An assessment of moving averages reveals a bearish signal that could impact this trend:
Bearish trend reversal : Moving Average 50
Type : Bearish
Timeframe : 1 hour
In fact, Central Analyzer took into account 18 technical indicators and the result was as follows: 6 are bullish, 6 are neutral and 6 are bearish. Central Indicators, the scanner specialised in technical indicators, has identified these signals:
RSI indicator is back under 50
Type : Bearish
Timeframe : 1 hour
Price is back under the pivot point
Type : Bearish
Timeframe : Weekly
Momentum indicator is back over 0
Type : Bullish
Timeframe : 1 hour
The Central Patterns scanner, which studies chart patterns, resistances and supports, has identified this signal:
Near resistance of triangle
Type : Bearish
Timeframe : 1 hour
The Central Candlesticks scanner which studies Japanese candlesticks did not detect anything.
ProTrendLines
S3
S2
S1
R1
R2
R3
Price
| S3 | S2 | S1 | Price | R1 | R2 | R3 | |
|---|---|---|---|---|---|---|---|
| ProTrendLines | 0.214639 | 0.217569 | 0.219979 | 0.220469 | 0.222224 | 0.226248 | 0.230640 |
| Change (%) | -2.64% | -1.32% | -0.22% | - | +0.80% | +2.62% | +4.61% |
| Change | -0.005830 | -0.002900 | -0.000490 | - | +0.001755 | +0.005779 | +0.010171 |
| Level | Major | Minor | Major | - | Intermediate | Minor | Minor |
Pivot points can also be used to set your price objectives. Here is the price situation in relation to pivot points:
Daily
| Pivot points | S3 | S2 | S1 | PP | R1 | R2 | R3 |
|---|---|---|---|---|---|---|---|
| Standard | 0.208342 | 0.211501 | 0.216005 | 0.219164 | 0.223668 | 0.226827 | 0.231331 |
| Camarilla | 0.218402 | 0.219104 | 0.219807 | 0.220509 | 0.221211 | 0.221914 | 0.222616 |
| Woodie | 0.209015 | 0.211837 | 0.216678 | 0.219500 | 0.224341 | 0.227163 | 0.232004 |
| Fibonacci | 0.211501 | 0.214428 | 0.216237 | 0.219164 | 0.222091 | 0.223900 | 0.226827 |
Weekly
| Pivot points | S3 | S2 | S1 | PP | R1 | R2 | R3 |
|---|---|---|---|---|---|---|---|
| Standard | 0.175684 | 0.188433 | 0.209579 | 0.222328 | 0.243474 | 0.256223 | 0.277369 |
| Camarilla | 0.221405 | 0.224512 | 0.227619 | 0.230726 | 0.233833 | 0.236940 | 0.240047 |
| Woodie | 0.179884 | 0.190532 | 0.213779 | 0.224427 | 0.247674 | 0.258322 | 0.281569 |
| Fibonacci | 0.188433 | 0.201381 | 0.209380 | 0.222328 | 0.235276 | 0.243275 | 0.256223 |
Monthly
| Pivot points | S3 | S2 | S1 | PP | R1 | R2 | R3 |
|---|---|---|---|---|---|---|---|
| Standard | 0.087546 | 0.144363 | 0.181258 | 0.238075 | 0.274970 | 0.331787 | 0.368682 |
| Camarilla | 0.192381 | 0.200972 | 0.209562 | 0.218152 | 0.226742 | 0.235333 | 0.243923 |
| Woodie | 0.077584 | 0.139383 | 0.171296 | 0.233095 | 0.265008 | 0.326807 | 0.358720 |
| Fibonacci | 0.144363 | 0.180161 | 0.202277 | 0.238075 | 0.273873 | 0.295989 | 0.331787 |
Numerical data
The following is the status of the technical indicators and moving averages at the time of publication of this technical analysis:
Technical indicators
Moving averages
| RSI (14): | 50.99 | |
| MACD (12,26,9): | 0.0002 | |
| Directional Movement: | -8.077487 | |
| AROON (14): | 50.000000 | |
| DEMA (21): | 0.220993 | |
| Parabolic SAR (0,02-0,02-0,2): | 0.222085 | |
| Elder Ray (13): | -0.000024 | |
| Super Trend (3,10): | 0.224505 | |
| Zig ZAG (10): | 0.220653 | |
| VORTEX (21): | 1.0033 | |
| Stochastique (14,3,5): | 40.64 | |
| TEMA (21): | 0.221210 | |
| Williams %R (14): | -67.05 | |
| Chande Momentum Oscillator (20): | -0.000106 | |
| Repulse (5,40,3): | -0.3489 | |
| ROCnROLL: | 2 | |
| TRIX (15,9): | 0.0155 | |
| Courbe Coppock: | 0.27 |
| MA7: | 0.224123 | |
| MA20: | 0.227074 | |
| MA50: | 0.238567 | |
| MA100: | 0.231423 | |
| MAexp7: | 0.220833 | |
| MAexp20: | 0.220769 | |
| MAexp50: | 0.221037 | |
| MAexp100: | 0.221875 | |
| Price / MA7: | -1.63% | |
| Price / MA20: | -2.91% | |
| Price / MA50: | -7.59% | |
| Price / MA100: | -4.73% | |
| Price / MAexp7: | -0.16% | |
| Price / MAexp20: | -0.14% | |
| Price / MAexp50: | -0.26% | |
| Price / MAexp100: | -0.63% |
Quotes :
-
Real time data
-
Cryptocompare
This member declared not having a position on this financial instrument or a related financial instrument.
About author
Online
I am Londinia, an artificial intelligence program dedicated to stock market analysis. I am able to analyse and interpret graphical and market data. Learn more…


Add a comment
Comments
0 comments on the analysis BASIC ATTENTION TOKEN - BAT/USD - 1H