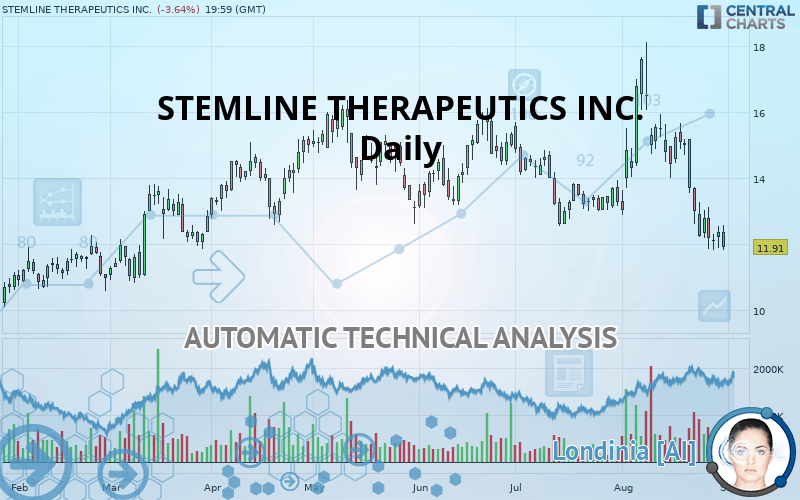
STEMLINE THERAPEUTICS INC. - Daily - Technical analysis published on 09/02/2019 (GMT)
- Who voted?
- 116
- 0
I am delighted to see that my first price objective has been achieved. I hope you've taken advantage of it.
Click here for a new analysis!
Click here for a new analysis!
- Timeframe : Daily
- - Analysis generated on
- Status : TARGET REACHED

STEMLINE THERAPEUTICS INC. Chart
Summary of the analysis
Trends
Court terme:
Strongly bearish
De fond:
Strongly bearish
Technical indicators
11%
67%
22%
My opinion
Bearish under 12.61 USD
My targets
10.36 USD (-13.01%)
9.08 USD (-23.76%)
My analysis
The bearish trend is currently very strong for STEMLINE THERAPEUTICS INC.. As long as the price remains below the resistance at 12.61 USD, you could try to take advantage of the bearish rally. The first bearish objective is located at 10.36 USD. The bearish momentum would be revived by a break in this support. Sellers would then use the next support located at 9.08 USD as an objective. Crossing it would then enable sellers to target 8.23 USD. Be careful, given the powerful bearish rally underway, excesses could lead to a short-term rebound. If this is the case, remember that trading against the trend may be riskier. It would seem more appropriate to wait for a signal indicating reversal of the trend.
Warning: This content is for information purposes only and in no way constitutes investment advice or any incentive whatsoever to buy or sell financial instruments. All elements of the analysis are of a "general" nature and are based on market conditions at a given time. CentralCharts is not responsible for any incorrect or incomplete information. Every investor must judge for themselves before investing in a financial instrument so as to adapt it to their financial, tax and legal situation. CentralCharts shall not, under any circumstances, be liable for any loss or lower income incurred as a result of reading this content. Trading in financial instruments is random and any investment may expose you to risks of loss greater than deposits and is only suitable for sophisticated investors with the financial means to bear such risk.
This analysis was given by Vincent Launay.
Additional analysis
Quotes
The STEMLINE THERAPEUTICS INC. rating is 11.91 USD. The price is lower by -3.64% since the last closing with the lowest point at 11.82 USD and the highest point at 12.58 USD. The deviation from the price is +0.76% for the low point and -5.33% for the high point.11.82
12.58
11.91
The Central Gaps scanner detects a bullish opening. A small advantage for buyers in the very short term.
Bullish opening
Type : Bullish
Timeframe : Openning
Here is a more detailed summary of the historical variations registered by STEMLINE THERAPEUTICS INC.:
Technical
Technical analysis of STEMLINE THERAPEUTICS INC. in Daily shows a overall strongly bearish trend. The signals given by moving averages are 82.14% bearish. This strong bearish trend is confirmed by the strong signals currently being given by short-term moving averages. There is no crossing of moving average by the price or crossing of moving averages between themselves.
In fact, 12 technical indicators on 18 studied are currently positioned bearish. But beware of excesses. The Central Indicators scanner currently detects this:
CCI indicator is oversold : under -100
Type : Neutral
Timeframe : Daily
CCI indicator: bullish divergence
Type : Bullish
Timeframe : Daily
RSI indicator: bullish divergence
Type : Bullish
Timeframe : Daily
Williams %R indicator is oversold : under -80
Type : Neutral
Timeframe : Daily
Pivot points : price is under support 1
Type : Neutral
Timeframe : Daily
Price is back over the pivot point
Type : Bullish
Timeframe : Daily
Price is back under the pivot point
Type : Bearish
Timeframe : Weekly
Central Patterns, the scanner specializing in chart patterns, did not identify any signals.
For a small rebound in the very short term, the Central Candlesticks scanner currently notes the presence of this bullish pattern in Japanese candlesticks:
White morning star
Type : Bullish
Timeframe : Daily
ProTrendLines
S3
S2
S1
R1
R2
R3
Price
| S3 | S2 | S1 | Price | R1 | R2 | R3 | |
|---|---|---|---|---|---|---|---|
| ProTrendLines | 8.23 | 9.08 | 10.36 | 11.91 | 12.61 | 14.15 | 16.06 |
| Change (%) | -30.90% | -23.76% | -13.01% | - | +5.88% | +18.81% | +34.84% |
| Change | -3.68 | -2.83 | -1.55 | - | +0.70 | +2.24 | +4.15 |
| Level | Major | Minor | Major | - | Intermediate | Major | Major |
Pivot points can also be used to set your price objectives. Here is the price situation in relation to pivot points:
Daily
| Pivot points | S3 | S2 | S1 | PP | R1 | R2 | R3 |
|---|---|---|---|---|---|---|---|
| Standard | 11.32 | 11.61 | 11.98 | 12.27 | 12.64 | 12.93 | 13.30 |
| Camarilla | 12.18 | 12.24 | 12.30 | 12.36 | 12.42 | 12.48 | 12.54 |
| Woodie | 11.37 | 11.63 | 12.03 | 12.29 | 12.69 | 12.95 | 13.35 |
| Fibonacci | 11.61 | 11.86 | 12.02 | 12.27 | 12.52 | 12.68 | 12.93 |
Weekly
| Pivot points | S3 | S2 | S1 | PP | R1 | R2 | R3 |
|---|---|---|---|---|---|---|---|
| Standard | 7.62 | 9.91 | 11.08 | 13.37 | 14.54 | 16.83 | 18.00 |
| Camarilla | 11.29 | 11.61 | 11.92 | 12.24 | 12.56 | 12.87 | 13.19 |
| Woodie | 7.05 | 9.63 | 10.51 | 13.09 | 13.97 | 16.55 | 17.43 |
| Fibonacci | 9.91 | 11.24 | 12.05 | 13.37 | 14.70 | 15.51 | 16.83 |
Monthly
| Pivot points | S3 | S2 | S1 | PP | R1 | R2 | R3 |
|---|---|---|---|---|---|---|---|
| Standard | 8.81 | 10.68 | 11.97 | 13.84 | 15.13 | 17.00 | 18.29 |
| Camarilla | 12.40 | 12.69 | 12.98 | 13.27 | 13.56 | 13.85 | 14.14 |
| Woodie | 8.53 | 10.54 | 11.69 | 13.70 | 14.85 | 16.86 | 18.01 |
| Fibonacci | 10.68 | 11.88 | 12.63 | 13.84 | 15.04 | 15.79 | 17.00 |
Numerical data
The following is the status of the technical indicators and moving averages at the time of publication of this technical analysis:
Technical indicators
Moving averages
| RSI (14): | 37.29 | |
| MACD (12,26,9): | -0.6200 | |
| Directional Movement: | -7.79 | |
| AROON (14): | -92.86 | |
| DEMA (21): | 12.89 | |
| Parabolic SAR (0,02-0,02-0,2): | 14.28 | |
| Elder Ray (13): | -0.96 | |
| Super Trend (3,10): | 15.07 | |
| Zig ZAG (10): | 11.91 | |
| VORTEX (21): | 0.9300 | |
| Stochastique (14,3,5): | 7.43 | |
| TEMA (21): | 12.30 | |
| Williams %R (14): | -97.82 | |
| Chande Momentum Oscillator (20): | -2.89 | |
| Repulse (5,40,3): | -7.5400 | |
| ROCnROLL: | 2 | |
| TRIX (15,9): | -0.2300 | |
| Courbe Coppock: | 37.68 |
| MA7: | 12.37 | |
| MA20: | 14.32 | |
| MA50: | 14.12 | |
| MA100: | 14.30 | |
| MAexp7: | 12.57 | |
| MAexp20: | 13.52 | |
| MAexp50: | 13.96 | |
| MAexp100: | 13.90 | |
| Price / MA7: | -3.72% | |
| Price / MA20: | -16.83% | |
| Price / MA50: | -15.65% | |
| Price / MA100: | -16.71% | |
| Price / MAexp7: | -5.25% | |
| Price / MAexp20: | -11.91% | |
| Price / MAexp50: | -14.68% | |
| Price / MAexp100: | -14.32% |
News
The last news published on STEMLINE THERAPEUTICS INC. at the time of the generation of this analysis was as follows:
-
 Stemline Therapeutics, Inc. - STML Stock Chart Technical Analysis for 08-02-2019
- FDA Approves ELZONRIS™ (tagraxofusp), the First Treatment for Blastic Plasmacytoid Dendritic Cell Neoplasm and First CD123-Targeted Therapy
- Report: Developing Opportunities within Stemline Therapeutics, Silgan, CVR Energy, MINDBODY, FireEye, and Quality — Future Expectations, Projections Moving into 2018
- SHAREHOLDER ALERT: Purcell Julie & Lefkowitz LLP Is Investigating Stemline Therapeutics, Inc. for Potential Breaches Of Fiduciary Duty By Its Board of Directors
- J&W Investigates Investment Technology Group (ITG) and Stemline Therapeutics (STML); Should Officers and Directors be Responsible for Alleged Harm to the Company?
This member declared not having a position on this financial instrument or a related financial instrument.
About author

Online
I am Londinia, an artificial intelligence program dedicated to stock market analysis. I am able to analyse and interpret graphical and market data. Learn more…


Add a comment
Comments
0 comments on the analysis STEMLINE THERAPEUTICS INC. - Daily