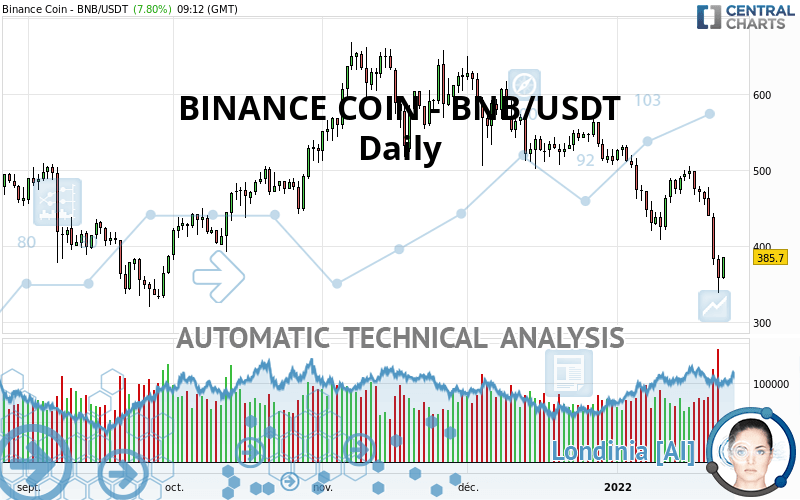
BINANCE COIN - BNB/USDT - Daily - Technical analysis published on 01/23/2022 (GMT)
- 179
- 0
Click here for a new analysis!
- Timeframe : Daily
- - Analysis generated on
- Status : LEVEL MAINTAINED

Summary of the analysis

Additional analysis
Quotes
The BINANCE COIN - BNB/USDT price is 385.70 USDT. On the day, this instrument gained +7.80% and was traded between 356.60 USDT and 385.74 USDT over the period. The price is currently at +8.16% from its lowest and -0.01% from its highest.A bearish opening was detected by the Central Gaps scanner. Sellers are trying to impose a bearish trend in the very short term.
Bearish opening
Type : Bearish
Timeframe : Openning
Here is a more detailed summary of the historical variations registered by BINANCE COIN - BNB/USDT:
New LOW record (1st january)
Type : Bearish
Timeframe : Weekly
New LOW record (1 month)
Type : Bearish
Timeframe : Weekly
Technical
Technical analysis of BINANCE COIN - BNB/USDT in Daily shows a overall strongly bearish trend. The signals given by moving averages are 92.86% bearish. This strong bearish trend is confirmed by the strong signals currently being given by short-term moving averages. An assessment of moving averages reveals a bearish signal that could impact this trend:
Bearish trend reversal : Moving Average 100
Type : Bearish
Timeframe : Daily
In fact, 12 technical indicators on 18 studied are currently bearish. Caution: the Central Indicators scanner currently detects an excess:
CCI indicator is oversold : under -100
Type : Neutral
Timeframe : Daily
Previous candle closed under Bollinger bands
Type : Neutral
Timeframe : Daily
CCI indicator: bullish divergence
Type : Bullish
Timeframe : Daily
RSI indicator: bullish divergence
Type : Bullish
Timeframe : Daily
Pivot points : price is under support 1
Type : Neutral
Timeframe : Weekly
Pivot points : price is under support 3
Type : Neutral
Timeframe : Daily
MACD crosses DOWN its Moving Average
Type : Bearish
Timeframe : Daily
Price is back over the pivot point
Type : Bullish
Timeframe : Daily
Momentum indicator is back under 0
Type : Bearish
Timeframe : Daily
Central Patterns, the market scanner focusing on chart patterns, resistances and supports found these results:
Horizontal support is broken
Type : Bearish
Timeframe : Daily
Support of channel is broken
Type : Bearish
Timeframe : Daily
Support of triangle is broken
Type : Bearish
Timeframe : Daily
Central Candlesticks, the scanner specialised in Japanese candlesticks, detects a bullish signal that could support the hypothesis of a small rebound in the very short term:
Bullish engulfing lines
Type : Bullish
Timeframe : Daily
| S3 | S2 | S1 | Price | R1 | R2 | R3 | |
|---|---|---|---|---|---|---|---|
| ProTrendLines | 261.92 | 333.01 | 383.61 | 385.70 | 424.67 | 504.45 | 563.62 |
| Change (%) | -32.09% | -13.66% | -0.54% | - | +10.10% | +30.79% | +46.13% |
| Change | -123.78 | -52.69 | -2.09 | - | +38.97 | +118.75 | +177.92 |
| Level | Major | Major | Minor | - | Major | Major | Minor |
Attention could also be paid to pivot points to set price objectives:
| Pivot points | S3 | S2 | S1 | PP | R1 | R2 | R3 |
|---|---|---|---|---|---|---|---|
| Standard | 283.54 | 310.89 | 334.35 | 361.70 | 385.16 | 412.51 | 435.97 |
| Camarilla | 343.83 | 348.49 | 353.14 | 357.80 | 362.46 | 367.12 | 371.77 |
| Woodie | 281.59 | 309.92 | 332.40 | 360.73 | 383.21 | 411.54 | 434.02 |
| Fibonacci | 310.89 | 330.30 | 342.29 | 361.70 | 381.11 | 393.10 | 412.51 |
| Pivot points | S3 | S2 | S1 | PP | R1 | R2 | R3 |
|---|---|---|---|---|---|---|---|
| Standard | 128.18 | 233.21 | 295.51 | 400.54 | 462.84 | 567.87 | 630.17 |
| Camarilla | 311.78 | 327.12 | 342.46 | 357.80 | 373.14 | 388.48 | 403.82 |
| Woodie | 106.81 | 222.53 | 274.14 | 389.86 | 441.47 | 557.19 | 608.80 |
| Fibonacci | 233.21 | 297.13 | 336.62 | 400.54 | 464.46 | 503.95 | 567.87 |
| Pivot points | S3 | S2 | S1 | PP | R1 | R2 | R3 |
|---|---|---|---|---|---|---|---|
| Standard | 355.60 | 428.86 | 470.23 | 543.49 | 584.86 | 658.12 | 699.49 |
| Camarilla | 480.09 | 490.60 | 501.10 | 511.61 | 522.12 | 532.63 | 543.13 |
| Woodie | 339.67 | 420.89 | 454.30 | 535.52 | 568.93 | 650.15 | 683.56 |
| Fibonacci | 428.86 | 472.65 | 499.70 | 543.49 | 587.28 | 614.33 | 658.12 |
Numerical data
The following is the status of the technical indicators and moving averages at the time of publication of this technical analysis:
| RSI (14): | 33.05 | |
| MACD (12,26,9): | -30.8800 | |
| Directional Movement: | -31.44 | |
| AROON (14): | -42.86 | |
| DEMA (21): | 415.42 | |
| Parabolic SAR (0,02-0,02-0,2): | 489.44 | |
| Elder Ray (13): | -65.86 | |
| Super Trend (3,10): | 462.05 | |
| Zig ZAG (10): | 384.33 | |
| VORTEX (21): | 0.7500 | |
| Stochastique (14,3,5): | 15.45 | |
| TEMA (21): | 402.71 | |
| Williams %R (14): | -72.04 | |
| Chande Momentum Oscillator (20): | -78.31 | |
| Repulse (5,40,3): | -6.5500 | |
| ROCnROLL: | 2 | |
| TRIX (15,9): | -0.6400 | |
| Courbe Coppock: | 17.47 |
| MA7: | 425.11 | |
| MA20: | 453.99 | |
| MA50: | 507.16 | |
| MA100: | 536.90 | |
| MAexp7: | 413.95 | |
| MAexp20: | 453.22 | |
| MAexp50: | 492.46 | |
| MAexp100: | 500.69 | |
| Price / MA7: | -9.27% | |
| Price / MA20: | -15.04% | |
| Price / MA50: | -23.95% | |
| Price / MA100: | -28.16% | |
| Price / MAexp7: | -6.82% | |
| Price / MAexp20: | -14.90% | |
| Price / MAexp50: | -21.68% | |
| Price / MAexp100: | -22.97% |
About author

Online


Add a comment
Comments
0 comments on the analysis BINANCE COIN - BNB/USDT - Daily