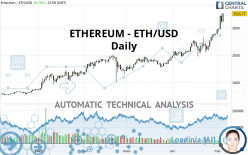
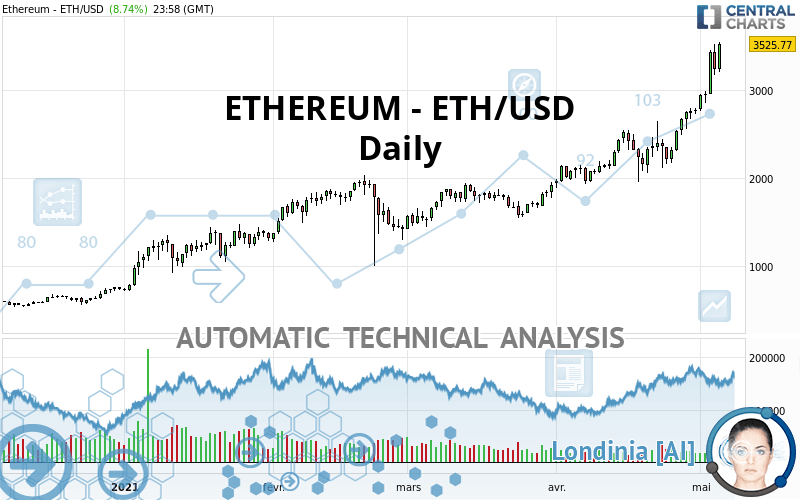
ETHEREUM - ETH/USD - Daily - Technical analysis published on 05/05/2021 (GMT)
- 180
- 0
Click here for a new analysis!
- Timeframe : Daily
- - Analysis generated on
- Status : TARGET REACHED
Summary of the analysis

Additional analysis
Quotes
ETHEREUM - ETH/USD rating 3,525.77 USD. The price has increased by +8.74% since the last closing and was traded between 3,211.22 USD and 3,547.84 USD over the period. The price is currently at +9.80% from its lowest and -0.62% from its highest.The Central Gaps scanner detects a bullish opening marking the presence of buyers ahead of sellers at the opening but not sufficiently marked to allow the price to register a quotation gap.
Bullish opening
Type : Bullish
Timeframe : Openning
A study of price movements over other periods shows the following variations:
New HIGH record (5 years)
Type : Bullish
Timeframe : Weekly
New HIGH record (1 year)
Type : Bullish
Timeframe : Weekly
New HIGH record (1st january)
Type : Bullish
Timeframe : Weekly
New HIGH record (1 month)
Type : Bullish
Timeframe : Weekly
Technical
Technical analysis of this Daily chart of ETHEREUM - ETH/USD indicates that the overall trend is strongly bullish. 92.86% of the signals given by moving averages are bullish. The overall trend is supported by the strong bullish signals from short-term moving averages. There is no crossing of moving average by the price or crossing of moving averages between themselves.
In fact, 15 technical indicators on 18 studied are currently bullish. Caution: the Central Indicators scanner currently detects an excess:
RSI indicator is overbought : over 70
Type : Neutral
Timeframe : Daily
CCI indicator is overbought : over 100
Type : Neutral
Timeframe : Daily
Williams %R indicator is overbought : over -20
Type : Neutral
Timeframe : Daily
Pivot points : price is over resistance 1
Type : Neutral
Timeframe : Daily
Pivot points : price is over resistance 2
Type : Neutral
Timeframe : Weekly
Price is back under the pivot point
Type : Bearish
Timeframe : Daily
No signals are given by Central Patterns, a market scanner specialised in chart patterns, resistances and supports.
No result was found by the Central Candlesticks scanner on Japanese candlesticks.
| S3 | S2 | S1 | Price | |
|---|---|---|---|---|
| ProTrendLines | 1,421.70 | 1,957.79 | 2,517.58 | 3,525.77 |
| Change (%) | -59.68% | -44.47% | -28.59% | - |
| Change | -2,104.07 | -1,567.98 | -1,008.19 | - |
| Level | Minor | Major | Major | - |
Pivot points can also be used to set your price objectives. Here is the price situation in relation to pivot points:
| Pivot points | S3 | S2 | S1 | PP | R1 | R2 | R3 |
|---|---|---|---|---|---|---|---|
| Standard | 2,744.11 | 2,958.81 | 3,100.53 | 3,315.23 | 3,456.95 | 3,671.65 | 3,813.37 |
| Camarilla | 3,144.25 | 3,176.92 | 3,209.59 | 3,242.26 | 3,274.93 | 3,307.60 | 3,340.28 |
| Woodie | 2,707.63 | 2,940.57 | 3,064.05 | 3,296.99 | 3,420.47 | 3,653.41 | 3,776.89 |
| Fibonacci | 2,958.81 | 3,094.96 | 3,179.07 | 3,315.23 | 3,451.38 | 3,535.49 | 3,671.65 |
| Pivot points | S3 | S2 | S1 | PP | R1 | R2 | R3 |
|---|---|---|---|---|---|---|---|
| Standard | 1,634.39 | 1,899.70 | 2,423.38 | 2,688.69 | 3,212.37 | 3,477.68 | 4,001.36 |
| Camarilla | 2,730.09 | 2,802.41 | 2,874.74 | 2,947.06 | 3,019.38 | 3,091.71 | 3,164.03 |
| Woodie | 1,763.58 | 1,964.29 | 2,552.57 | 2,753.28 | 3,341.56 | 3,542.27 | 4,130.55 |
| Fibonacci | 1,899.70 | 2,201.09 | 2,387.30 | 2,688.69 | 2,990.08 | 3,176.29 | 3,477.68 |
| Pivot points | S3 | S2 | S1 | PP | R1 | R2 | R3 |
|---|---|---|---|---|---|---|---|
| Standard | 1,260.12 | 1,572.79 | 2,174.64 | 2,487.31 | 3,089.16 | 3,401.83 | 4,003.68 |
| Camarilla | 2,524.99 | 2,608.82 | 2,692.65 | 2,776.48 | 2,860.31 | 2,944.14 | 3,027.97 |
| Woodie | 1,404.70 | 1,645.09 | 2,319.22 | 2,559.61 | 3,233.74 | 3,474.13 | 4,148.26 |
| Fibonacci | 1,572.79 | 1,922.14 | 2,137.97 | 2,487.31 | 2,836.66 | 3,052.49 | 3,401.83 |
Numerical data
The following is the status of the technical indicators and moving averages at the time of publication of this technical analysis:
| RSI (14): | 77.19 | |
| MACD (12,26,9): | 309.7700 | |
| Directional Movement: | 29.30 | |
| AROON (14): | 85.71 | |
| DEMA (21): | 3,117.42 | |
| Parabolic SAR (0,02-0,02-0,2): | 2,674.27 | |
| Elder Ray (13): | 462.73 | |
| Super Trend (3,10): | 2,660.08 | |
| Zig ZAG (10): | 3,528.78 | |
| VORTEX (21): | 1.1800 | |
| Stochastique (14,3,5): | 92.19 | |
| TEMA (21): | 3,280.59 | |
| Williams %R (14): | -1.20 | |
| Chande Momentum Oscillator (20): | 1,157.94 | |
| Repulse (5,40,3): | 16.7500 | |
| ROCnROLL: | 1 | |
| TRIX (15,9): | 1.4100 | |
| Courbe Coppock: | 69.33 |
| MA7: | 3,090.46 | |
| MA20: | 2,637.31 | |
| MA50: | 2,222.40 | |
| MA100: | 1,943.19 | |
| MAexp7: | 3,139.72 | |
| MAexp20: | 2,747.98 | |
| MAexp50: | 2,349.77 | |
| MAexp100: | 1,980.98 | |
| Price / MA7: | +14.09% | |
| Price / MA20: | +33.69% | |
| Price / MA50: | +58.65% | |
| Price / MA100: | +81.44% | |
| Price / MAexp7: | +12.30% | |
| Price / MAexp20: | +28.30% | |
| Price / MAexp50: | +50.05% | |
| Price / MAexp100: | +77.98% |
About author

Online


Add a comment
Comments
0 comments on the analysis ETHEREUM - ETH/USD - Daily