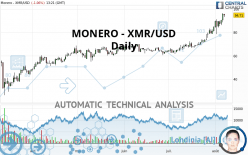
MONERO - XMR/USD - Daily - Technical analysis published on 08/07/2020 (GMT)
- Who voted?
- 150
- 0
Click here for a new analysis!
- Timeframe : Daily
- - Analysis generated on
- Status : INVALID

Summary of the analysis

Additional analysis
Quotes
The MONERO - XMR/USD rating is 94.71 USD. On the day, this instrument lost -1.06% with the lowest point at 93.12 USD and the highest point at 95.57 USD. The deviation from the price is +1.71% for the low point and -0.90% for the high point.The Central Gaps scanner detects a bearish opening. A small advantage for sellers in the very short term.
Bearish opening
Type : Bearish
Timeframe : Openning
A study of price movements over other periods shows the following variations:
Near a new HIGH record (1st january)
Type : Bullish
Timeframe : Weekly
Near a new HIGH record (1 month)
Type : Bullish
Timeframe : Weekly
Technical
Technical analysis of MONERO - XMR/USD in Daily shows a strongly overall bullish trend. The signals given by the moving averages are 92.86% bullish. This strong bullish trend is confirmed by the strong signals currently being given by short-term moving averages. There is no crossing of moving average by the price or crossing of moving averages between themselves.
An assessment of technical indicators shows a strong bullish signal.
Caution: the Central Indicators scanner currently detects an excess:
RSI indicator is overbought : over 70
Type : Neutral
Timeframe : Daily
CCI indicator is overbought : over 100
Type : Neutral
Timeframe : Daily
Williams %R indicator is overbought : over -20
Type : Neutral
Timeframe : Daily
Parabolic SAR indicator bullish reversal
Type : Bullish
Timeframe : Daily
Price is back over the pivot point
Type : Bullish
Timeframe : Daily
Price is back over the pivot point
Type : Bullish
Timeframe : Weekly
An analysis of the price chart with the Central Patterns scanner (detector of chart patterns and resistances and supports) shows several results that can have an impact on the price change:
Near horizontal resistance
Type : Bearish
Timeframe : Daily
Resistance of channel is broken
Type : Bullish
Timeframe : Daily
The Central Candlesticks scanner which studies Japanese candlesticks did not detect anything.
| S3 | S2 | S1 | Price | R1 | R2 | R3 | |
|---|---|---|---|---|---|---|---|
| ProTrendLines | 69.81 | 83.54 | 89.68 | 94.71 | 95.04 | 116.87 | 292.94 |
| Change (%) | -26.29% | -11.79% | -5.31% | - | +0.35% | +23.40% | +209.30% |
| Change | -24.90 | -11.17 | -5.03 | - | +0.33 | +22.16 | +198.23 |
| Level | Intermediate | Intermediate | Intermediate | - | Major | Intermediate | Minor |
Attention could also be paid to pivot points to set price objectives:
| Pivot points | S3 | S2 | S1 | PP | R1 | R2 | R3 |
|---|---|---|---|---|---|---|---|
| Standard | 82.83 | 85.71 | 90.72 | 93.60 | 98.61 | 101.49 | 106.50 |
| Camarilla | 93.55 | 94.27 | 95.00 | 95.72 | 96.44 | 97.17 | 97.89 |
| Woodie | 83.89 | 86.24 | 91.78 | 94.13 | 99.67 | 102.02 | 107.56 |
| Fibonacci | 85.71 | 88.73 | 90.59 | 93.60 | 96.62 | 98.48 | 101.49 |
| Pivot points | S3 | S2 | S1 | PP | R1 | R2 | R3 |
|---|---|---|---|---|---|---|---|
| Standard | 61.53 | 67.38 | 78.53 | 84.38 | 95.53 | 101.38 | 112.53 |
| Camarilla | 85.01 | 86.56 | 88.12 | 89.68 | 91.24 | 92.80 | 94.36 |
| Woodie | 64.18 | 68.71 | 81.18 | 85.71 | 98.18 | 102.71 | 115.18 |
| Fibonacci | 67.38 | 73.87 | 77.89 | 84.38 | 90.87 | 94.89 | 101.38 |
| Pivot points | S3 | S2 | S1 | PP | R1 | R2 | R3 |
|---|---|---|---|---|---|---|---|
| Standard | 45.63 | 53.50 | 69.10 | 76.97 | 92.57 | 100.44 | 116.04 |
| Camarilla | 78.26 | 80.41 | 82.56 | 84.71 | 86.86 | 89.01 | 91.16 |
| Woodie | 49.51 | 55.43 | 72.98 | 78.90 | 96.45 | 102.37 | 119.92 |
| Fibonacci | 53.50 | 62.46 | 68.00 | 76.97 | 85.93 | 91.47 | 100.44 |
Numerical data
The following is the status of the technical indicators and moving averages at the time of publication of this technical analysis:
| RSI (14): | 74.03 | |
| MACD (12,26,9): | 6.4400 | |
| Directional Movement: | 23.42 | |
| AROON (14): | 92.86 | |
| DEMA (21): | 90.45 | |
| Parabolic SAR (0,02-0,02-0,2): | 78.88 | |
| Elder Ray (13): | 8.19 | |
| Super Trend (3,10): | 80.02 | |
| Zig ZAG (10): | 94.76 | |
| VORTEX (21): | 1.2700 | |
| Stochastique (14,3,5): | 94.99 | |
| TEMA (21): | 94.06 | |
| Williams %R (14): | -6.98 | |
| Chande Momentum Oscillator (20): | 21.24 | |
| Repulse (5,40,3): | 5.4500 | |
| ROCnROLL: | 1 | |
| TRIX (15,9): | 1.0200 | |
| Courbe Coppock: | 49.27 |
| MA7: | 90.07 | |
| MA20: | 80.52 | |
| MA50: | 71.58 | |
| MA100: | 68.08 | |
| MAexp7: | 89.88 | |
| MAexp20: | 82.61 | |
| MAexp50: | 74.85 | |
| MAexp100: | 69.73 | |
| Price / MA7: | +5.15% | |
| Price / MA20: | +17.62% | |
| Price / MA50: | +32.31% | |
| Price / MA100: | +39.12% | |
| Price / MAexp7: | +5.37% | |
| Price / MAexp20: | +14.65% | |
| Price / MAexp50: | +26.53% | |
| Price / MAexp100: | +35.82% |
About author

Online


Add a comment
Comments
0 comments on the analysis MONERO - XMR/USD - Daily