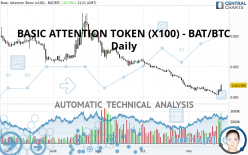
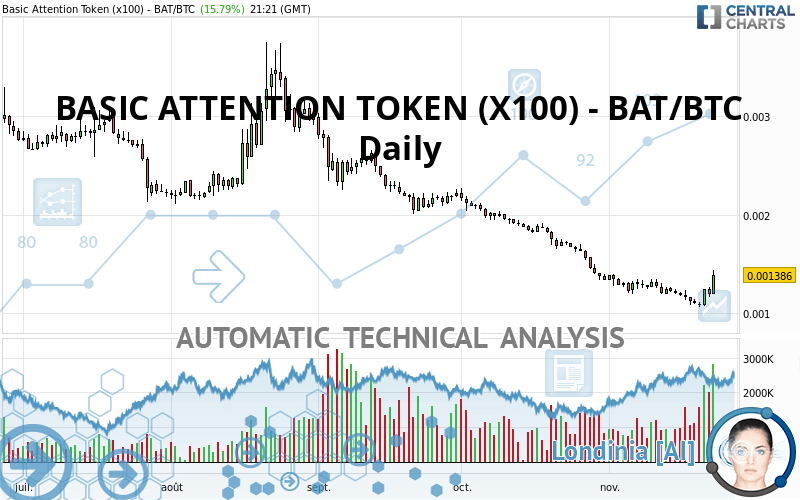
BASIC ATTENTION TOKEN (X100) - BAT/BTC - Daily - Technical analysis published on 11/23/2020 (GMT)
- 201
- 0
Click here for a new analysis!
- Timeframe : Daily
- - Analysis generated on
- Status : TARGET REACHED
Summary of the analysis

Additional analysis
Quotes
BASIC ATTENTION TOKEN (X100) - BAT/BTC rating 0.001386 BTC. On the day, this instrument gained +15.79% and was between 0.001196 BTC and 0.001437 BTC. This implies that the price is at +15.89% from its lowest and at -3.55% from its highest.A bullish opening was detected by the Central Gaps scanner. Buyers are trying to impose a bullish momentum in the very short term.
Bullish opening
Type : Bullish
Timeframe : Openning
A study of price movements over other periods shows the following variations:
Technical
Technical analysis of BASIC ATTENTION TOKEN (X100) - BAT/BTC in Daily shows an overall bearish trend. The signals given by moving averages are 71.43% bearish. This bearish trend could slow down given the neutral signals currently being given by short-term moving averages. An assessment of moving averages reveals several bearish signals that could impact this trend:
Bearish price crossover with Moving Average 20
Type : Bearish
Timeframe : Daily
Bearish price crossover with adaptative moving average 20
Type : Bearish
Timeframe : Daily
Bearish price crossover with adaptative moving average 50
Type : Bearish
Timeframe : Daily
The probability of a further increase are moderate given the direction of the technical indicators.
But beware of excesses. The Central Indicators scanner currently detects this:
Williams %R indicator is overbought : over -20
Type : Neutral
Timeframe : Daily
Pivot points : price is over resistance 2
Type : Neutral
Timeframe : Weekly
Pivot points : price is over resistance 3
Type : Neutral
Timeframe : Daily
Price is back under the pivot point
Type : Bearish
Timeframe : Daily
Williams %R indicator is back under -50
Type : Bearish
Timeframe : Daily
Central Patterns, the market scanner focusing on chart patterns, resistances and supports found this result:
Horizontal resistance is broken
Type : Bullish
Timeframe : Daily
No result was found by the Central Candlesticks scanner on Japanese candlesticks.
| S1 | Price | R1 | R2 | R3 | |
|---|---|---|---|---|---|
| ProTrendLines | 0.001318 | 0.001386 | 0.002290 | 0.003021 | 0.003458 |
| Change (%) | -4.91% | - | +65.22% | +117.97% | +149.49% |
| Change | -0.000068 | - | +0.000904 | +0.001635 | +0.002072 |
| Level | Minor | - | Intermediate | Intermediate | Intermediate |
Attention could also be paid to pivot points to set price objectives:
| Pivot points | S3 | S2 | S1 | PP | R1 | R2 | R3 |
|---|---|---|---|---|---|---|---|
| Standard | 0.001054 | 0.001110 | 0.001154 | 0.001210 | 0.001254 | 0.001310 | 0.001354 |
| Camarilla | 0.001170 | 0.001179 | 0.001188 | 0.001197 | 0.001206 | 0.001215 | 0.001225 |
| Woodie | 0.001047 | 0.001107 | 0.001147 | 0.001207 | 0.001247 | 0.001307 | 0.001347 |
| Fibonacci | 0.001110 | 0.001149 | 0.001172 | 0.001210 | 0.001249 | 0.001272 | 0.001310 |
| Pivot points | S3 | S2 | S1 | PP | R1 | R2 | R3 |
|---|---|---|---|---|---|---|---|
| Standard | 0.000938 | 0.001002 | 0.001125 | 0.001189 | 0.001312 | 0.001376 | 0.001499 |
| Camarilla | 0.001198 | 0.001215 | 0.001232 | 0.001249 | 0.001266 | 0.001283 | 0.001300 |
| Woodie | 0.000969 | 0.001017 | 0.001156 | 0.001204 | 0.001343 | 0.001391 | 0.001530 |
| Fibonacci | 0.001002 | 0.001073 | 0.001117 | 0.001189 | 0.001260 | 0.001304 | 0.001376 |
| Pivot points | S3 | S2 | S1 | PP | R1 | R2 | R3 |
|---|---|---|---|---|---|---|---|
| Standard | 0.000091 | 0.000714 | 0.001026 | 0.001649 | 0.001961 | 0.002584 | 0.002896 |
| Camarilla | 0.001081 | 0.001167 | 0.001252 | 0.001338 | 0.001424 | 0.001509 | 0.001595 |
| Woodie | -0.000065 | 0.000636 | 0.000871 | 0.001571 | 0.001806 | 0.002506 | 0.002741 |
| Fibonacci | 0.000714 | 0.001071 | 0.001292 | 0.001649 | 0.002006 | 0.002227 | 0.002584 |
Numerical data
The following are the details of the technical indicators and moving averages that were collected to generate this technical analysis:
| RSI (14): | 54.78 | |
| MACD (12,26,9): | -0.0001 | |
| Directional Movement: | 4.535604 | |
| AROON (14): | 21.428574 | |
| DEMA (21): | 0.001135 | |
| Parabolic SAR (0,02-0,02-0,2): | 0.001073 | |
| Elder Ray (13): | 0.000078 | |
| Super Trend (3,10): | 0.001013 | |
| Zig ZAG (10): | 0.001398 | |
| VORTEX (21): | 0.9563 | |
| Stochastique (14,3,5): | 69.33 | |
| TEMA (21): | 0.001193 | |
| Williams %R (14): | -2.50 | |
| Chande Momentum Oscillator (20): | 0.000136 | |
| Repulse (5,40,3): | 22.3705 | |
| ROCnROLL: | -1 | |
| TRIX (15,9): | -1.2067 | |
| Courbe Coppock: | 10.65 |
| MA7: | 0.001193 | |
| MA20: | 0.001234 | |
| MA50: | 0.001531 | |
| MA100: | 0.002040 | |
| MAexp7: | 0.001242 | |
| MAexp20: | 0.001269 | |
| MAexp50: | 0.001516 | |
| MAexp100: | 0.001820 | |
| Price / MA7: | +16.18% | |
| Price / MA20: | +12.32% | |
| Price / MA50: | -9.47% | |
| Price / MA100: | -32.06% | |
| Price / MAexp7: | +11.59% | |
| Price / MAexp20: | +9.22% | |
| Price / MAexp50: | -8.58% | |
| Price / MAexp100: | -23.85% |
About author

Online


Add a comment
Comments
0 comments on the analysis BASIC ATTENTION TOKEN (X100) - BAT/BTC - Daily