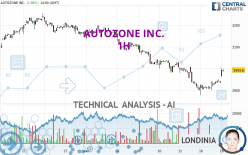
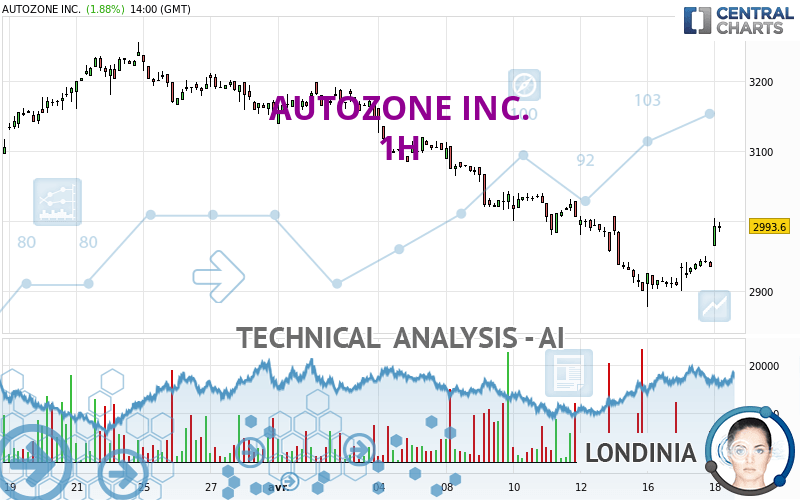
AUTOZONE INC. - 1H - Technical analysis published on 04/18/2024 (GMT)
- 71
- 0
- Timeframe : 1H
- - Analysis generated on
- Status : NEUTRAL
Summary of the analysis

Additional analysis
Quotes
The AUTOZONE INC. price is 2,990.79 USD. The price has increased by +1.79% since the last closing and was traded between 2,964.06 USD and 3,005.00 USD over the period. The price is currently at +0.90% from its lowest and -0.47% from its highest.The Central Gaps scanner detects a bullish gap which is a sign that buyers have taken the lead in the very short term.
Opening Gap UP
Type : Bullish
Timeframe : Openning
A study of price movements over other periods shows the following variations:
Near a new LOW record (1 month)
Type : Bearish
Timeframe : Weekly
Technical
A technical analysis in 1H of this AUTOZONE INC. chart shows a bearish trend. The signals given by the moving averages are at 64.29% bearish. This bearish trend could quickly slow down given the strong bullish signals currently being given by short-term moving averages. The Central Indicators market scanner is currently detecting several bullish signals that could impact this trend:
Bullish price crossover with Moving Average 50
Type : Bullish
Timeframe : 1 hour
Bullish price crossover with adaptative moving average 20
Type : Bullish
Timeframe : 1 hour
Bullish price crossover with adaptative moving average 50
Type : Bullish
Timeframe : 1 hour
Bullish price crossover with adaptative moving average 100
Type : Bullish
Timeframe : 1 hour
In fact, 11 technical indicators on 18 studied are currently positioned bullish. Caution: the Central Indicators scanner currently detects an excess:
CCI indicator is overbought : over 100
Type : Neutral
Timeframe : 1 hour
Pivot points : price is over resistance 1
Type : Neutral
Timeframe : 1 hour
RSI indicator is back over 50
Type : Bullish
Timeframe : 1 hour
SuperTrend indicator bullish reversal
Type : Bullish
Timeframe : 1 hour
Central Patterns, the market scanner focusing on chart patterns, resistances and supports found these results:
Near horizontal resistance
Type : Bearish
Timeframe : 1 hour
Resistance of channel is broken
Type : Bullish
Timeframe : 1 hour
Central Candlesticks, the scanner specialised in Japanese candlesticks, detects a bearish signal that could support the hypothesis of a small drop in the very short term:
Bearish harami cross
Type : Bearish
Timeframe : 1 hour
| S3 | S2 | S1 | Price | R1 | R2 | R3 | |
|---|---|---|---|---|---|---|---|
| ProTrendLines | 2,733.65 | 2,841.76 | 2,877.20 | 2,990.79 | 3,007.56 | 3,059.51 | 3,094.84 |
| Change (%) | -8.60% | -4.98% | -3.80% | - | +0.56% | +2.30% | +3.48% |
| Change | -257.14 | -149.03 | -113.59 | - | +16.77 | +68.72 | +104.05 |
| Level | Major | Minor | Intermediate | - | Intermediate | Intermediate | Minor |
Attention could also be paid to pivot points to set price objectives:
| Pivot points | S3 | S2 | S1 | PP | R1 | R2 | R3 |
|---|---|---|---|---|---|---|---|
| Standard | 2,859.56 | 2,879.78 | 2,909.02 | 2,929.24 | 2,958.48 | 2,978.70 | 3,007.94 |
| Camarilla | 2,924.66 | 2,929.19 | 2,933.73 | 2,938.26 | 2,942.79 | 2,947.33 | 2,951.86 |
| Woodie | 2,864.07 | 2,882.04 | 2,913.53 | 2,931.50 | 2,962.99 | 2,980.96 | 3,012.45 |
| Fibonacci | 2,879.78 | 2,898.67 | 2,910.35 | 2,929.24 | 2,948.13 | 2,959.81 | 2,978.70 |
| Pivot points | S3 | S2 | S1 | PP | R1 | R2 | R3 |
|---|---|---|---|---|---|---|---|
| Standard | 2,749.03 | 2,852.15 | 2,907.23 | 3,010.35 | 3,065.43 | 3,168.55 | 3,223.63 |
| Camarilla | 2,918.82 | 2,933.32 | 2,947.82 | 2,962.32 | 2,976.82 | 2,991.32 | 3,005.83 |
| Woodie | 2,725.02 | 2,840.14 | 2,883.22 | 2,998.34 | 3,041.42 | 3,156.54 | 3,199.62 |
| Fibonacci | 2,852.15 | 2,912.58 | 2,949.91 | 3,010.35 | 3,070.78 | 3,108.11 | 3,168.55 |
| Pivot points | S3 | S2 | S1 | PP | R1 | R2 | R3 |
|---|---|---|---|---|---|---|---|
| Standard | 2,731.09 | 2,857.09 | 3,004.37 | 3,130.37 | 3,277.65 | 3,403.65 | 3,550.93 |
| Camarilla | 3,076.50 | 3,101.55 | 3,126.60 | 3,151.65 | 3,176.70 | 3,201.75 | 3,226.80 |
| Woodie | 2,741.73 | 2,862.41 | 3,015.01 | 3,135.69 | 3,288.29 | 3,408.97 | 3,561.57 |
| Fibonacci | 2,857.09 | 2,961.48 | 3,025.98 | 3,130.37 | 3,234.76 | 3,299.26 | 3,403.65 |
Numerical data
The following is the status of technical indicators and moving averages registered at the time this technical analysis was created:
| RSI (14): | 59.58 | |
| MACD (12,26,9): | -8.2600 | |
| Directional Movement: | 14.51 | |
| AROON (14): | 100.00 | |
| DEMA (21): | 2,925.26 | |
| Parabolic SAR (0,02-0,02-0,2): | 2,898.65 | |
| Elder Ray (13): | 45.38 | |
| Super Trend (3,10): | 2,919.54 | |
| Zig ZAG (10): | 2,978.37 | |
| VORTEX (21): | 0.8900 | |
| Stochastique (14,3,5): | 81.45 | |
| TEMA (21): | 2,940.22 | |
| Williams %R (14): | -25.36 | |
| Chande Momentum Oscillator (20): | 62.94 | |
| Repulse (5,40,3): | -0.0700 | |
| ROCnROLL: | -1 | |
| TRIX (15,9): | -0.0900 | |
| Courbe Coppock: | 1.67 |
| MA7: | 2,962.52 | |
| MA20: | 3,083.83 | |
| MA50: | 2,992.93 | |
| MA100: | 2,826.17 | |
| MAexp7: | 2,959.42 | |
| MAexp20: | 2,941.77 | |
| MAexp50: | 2,979.27 | |
| MAexp100: | 3,027.92 | |
| Price / MA7: | +0.95% | |
| Price / MA20: | -3.02% | |
| Price / MA50: | -0.07% | |
| Price / MA100: | +5.82% | |
| Price / MAexp7: | +1.06% | |
| Price / MAexp20: | +1.67% | |
| Price / MAexp50: | +0.39% | |
| Price / MAexp100: | -1.23% |
News
Don't forget to follow the news on AUTOZONE INC.. At the time of publication of this analysis, the latest news was as follows:
- Thinking about trading options or stock in Alphabet Inc, Autozone, Zoom Video Communications, TransMedics Group, or Viking Therapeutics?
- WEX Customers Can Now Save on AutoZone Parts
- Lectron Unveils New Retail Partnership with AutoZone, America's Leading Auto Parts Retailer
- Thinking about trading options or stock in DoorDash, Fiverr, AutoZone, Amazon, or Tesla?
- Unique Logistics International Adds AutoZone Inc. As New Customer
About author
Online


Add a comment
Comments
0 comments on the analysis AUTOZONE INC. - 1H