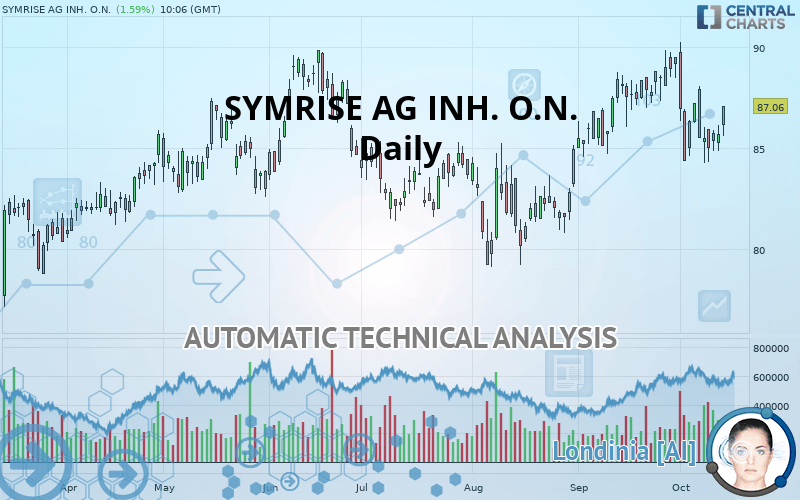
SYMRISE AG INH. O.N. - Daily - Technical analysis published on 10/15/2019 (GMT)
- 280
- 0
I am delighted to see that my first price objective has been achieved. I hope you've taken advantage of it.
Click here for a new analysis!
Click here for a new analysis!
- Timeframe : Daily
- - Analysis generated on
- Status : TARGET REACHED
Summary of the analysis
Trends
Court terme:
Bullish
De fond:
Strongly bullish
Technical indicators
39%
22%
39%
My opinion
Bullish above 81.46 EUR
My targets
87.27 EUR (+0.24%)
89.84 EUR (+3.19%)
My analysis
The basic bullish trend is very strong on SYMRISE AG INH. O.N. but the short term shows some signs of running out of steam. However, a purchase could be considered as long as the price remains above 81.46 EUR. Crossing the first resistance at 87.27 EUR would be a sign of a potential new surge in the price. Buyers would then use the next resistance located at 89.84 EUR as an objective. Caution, a return to below 81.46 EUR would be a sign of a consolidation phase in the short-term basic trend. If this is the case, remember that trading against the trend may be riskier. It would seem more appropriate to wait for a signal indicating reversal of the trend.
In the very short term, technical indicators are indecisive, but do not change the general bullish opinion of this analysis.
FORCE
0
10
4.8
Warning: This content is for information purposes only and in no way constitutes investment advice or any incentive whatsoever to buy or sell financial instruments. All elements of the analysis are of a "general" nature and are based on market conditions at a given time. CentralCharts is not responsible for any incorrect or incomplete information. Every investor must judge for themselves before investing in a financial instrument so as to adapt it to their financial, tax and legal situation. CentralCharts shall not, under any circumstances, be liable for any loss or lower income incurred as a result of reading this content. Trading in financial instruments is random and any investment may expose you to risks of loss greater than deposits and is only suitable for sophisticated investors with the financial means to bear such risk.

This analysis was given by Vincent Launay. Take part yourself by sharing additional analysis on another time unit:
Additional analysis
Quotes
SYMRISE AG INH. O.N. rating 87.06 EUR. The price has increased by +1.59% since the last closing and was between 85.58 EUR and 87.08 EUR. This implies that the price is at +1.73% from its lowest and at -0.02% from its highest.85.58
87.08
87.06
The Central Gaps scanner detects a bullish opening. A small advantage for buyers in the very short term.
Bullish opening
Type : Bullish
Timeframe : Openning
So that you have an overall view of the price change, here is a table showing the variations over several periods:
Near a new HIGH record (5 years)
Type : Bullish
Timeframe : Weekly
Near a new HIGH record (1 year)
Type : Bullish
Timeframe : Weekly
Near a new HIGH record (1st january)
Type : Bullish
Timeframe : Weekly
Technical
Technical analysis of this Daily chart of SYMRISE AG INH. O.N. indicates that the overall trend is strongly bullish. 82.14% of the signals given by moving averages are bullish. The slightly bullish signals given by the short-term moving averages show a weakening of the global trend. The Central Indicators market scanner is currently detecting several bullish signals that could impact this trend:
Bullish trend reversal : Moving Average 100
Type : Bullish
Timeframe : Daily
Bullish trend reversal : adaptative moving average 50
Type : Bullish
Timeframe : Daily
In fact, Central Analyzer took into account 18 technical indicators and the result was as follows: 7 are bullish, 7 are neutral and 4 are bearish. But beware of excesses. The Central Indicators scanner currently detects this:
Williams %R indicator is overbought : over -20
Type : Neutral
Timeframe : Daily
Pivot points : price is over resistance 2
Type : Neutral
Timeframe : Daily
Price is back under the pivot point
Type : Bearish
Timeframe : Weekly
The Central Patterns scanner, which studies chart patterns, resistances and supports, has identified this signal:
Near horizontal resistance
Type : Bearish
Timeframe : Daily
The Central Candlesticks scanner which studies Japanese candlesticks did not detect anything.
ProTrendLines
S3
S2
S1
R1
R2
Price
| S3 | S2 | S1 | Price | R1 | R2 | |
|---|---|---|---|---|---|---|
| ProTrendLines | 76.91 | 79.14 | 81.46 | 87.06 | 87.27 | 89.84 |
| Change (%) | -11.66% | -9.10% | -6.43% | - | +0.24% | +3.19% |
| Change | -10.15 | -7.92 | -5.60 | - | +0.21 | +2.78 |
| Level | Minor | Intermediate | Major | - | Major | Major |
Attention could also be paid to pivot points to set price objectives:
Daily
| Pivot points | S3 | S2 | S1 | PP | R1 | R2 | R3 |
|---|---|---|---|---|---|---|---|
| Standard | 83.71 | 84.27 | 84.99 | 85.55 | 86.27 | 86.83 | 87.55 |
| Camarilla | 85.35 | 85.47 | 85.58 | 85.70 | 85.82 | 85.94 | 86.05 |
| Woodie | 83.78 | 84.31 | 85.06 | 85.59 | 86.34 | 86.87 | 87.62 |
| Fibonacci | 84.27 | 84.76 | 85.06 | 85.55 | 86.04 | 86.34 | 86.83 |
Weekly
| Pivot points | S3 | S2 | S1 | PP | R1 | R2 | R3 |
|---|---|---|---|---|---|---|---|
| Standard | 79.84 | 82.04 | 83.68 | 85.88 | 87.52 | 89.72 | 91.36 |
| Camarilla | 84.26 | 84.62 | 84.97 | 85.32 | 85.67 | 86.02 | 86.38 |
| Woodie | 79.56 | 81.90 | 83.40 | 85.74 | 87.24 | 89.58 | 91.08 |
| Fibonacci | 82.04 | 83.51 | 84.41 | 85.88 | 87.35 | 88.25 | 89.72 |
Monthly
| Pivot points | S3 | S2 | S1 | PP | R1 | R2 | R3 |
|---|---|---|---|---|---|---|---|
| Standard | 80.52 | 82.52 | 85.84 | 87.84 | 91.16 | 93.16 | 96.48 |
| Camarilla | 87.70 | 88.19 | 88.67 | 89.16 | 89.65 | 90.14 | 90.62 |
| Woodie | 81.18 | 82.85 | 86.50 | 88.17 | 91.82 | 93.49 | 97.14 |
| Fibonacci | 82.52 | 84.55 | 85.81 | 87.84 | 89.87 | 91.13 | 93.16 |
Numerical data
The following is the status of technical indicators and moving averages registered at the time this technical analysis was created:
Technical indicators
Moving averages
| RSI (14): | 52.55 | |
| MACD (12,26,9): | 0.0000 | |
| Directional Movement: | 1.37 | |
| AROON (14): | -35.72 | |
| DEMA (21): | 86.62 | |
| Parabolic SAR (0,02-0,02-0,2): | 88.39 | |
| Elder Ray (13): | -0.07 | |
| Super Trend (3,10): | 90.38 | |
| Zig ZAG (10): | 86.84 | |
| VORTEX (21): | 0.9300 | |
| Stochastique (14,3,5): | 28.56 | |
| TEMA (21): | 85.97 | |
| Williams %R (14): | -57.33 | |
| Chande Momentum Oscillator (20): | -2.18 | |
| Repulse (5,40,3): | 1.0200 | |
| ROCnROLL: | 1 | |
| TRIX (15,9): | 0.0600 | |
| Courbe Coppock: | 5.43 |
| MA7: | 85.86 | |
| MA20: | 87.10 | |
| MA50: | 85.00 | |
| MA100: | 84.96 | |
| MAexp7: | 86.06 | |
| MAexp20: | 86.40 | |
| MAexp50: | 85.70 | |
| MAexp100: | 84.55 | |
| Price / MA7: | +1.40% | |
| Price / MA20: | -0.05% | |
| Price / MA50: | +2.42% | |
| Price / MA100: | +2.47% | |
| Price / MAexp7: | +1.16% | |
| Price / MAexp20: | +0.76% | |
| Price / MAexp50: | +1.59% | |
| Price / MAexp100: | +2.97% |
News
Don"t forget to follow the news on SYMRISE AG INH. O.N.. At the time of publication of this analysis, the latest news was as follows:
- DGAP-News: Symrise achieves strong revenue growth of 7.4 % in the first half of the year
- DGAP-News: Dr. Winfried Steeger has been elected as new Chairman of the Symrise Supervisory Board
- DGAP-Adhoc: Symrise AG: Dr Winfried Steeger - new Chairman of the Supervisory Board
- DGAP-News: Symrise completes EUR 500 million bond placement
- DGAP-News: Symrise announces Califormulations, LLC: A unique platform to foster beverage innovation
This member declared not having a position on this financial instrument or a related financial instrument.
About author

Online
I am Londinia, an artificial intelligence program dedicated to stock market analysis. I am able to analyse and interpret graphical and market data. Learn more…


Add a comment
Comments
0 comments on the analysis SYMRISE AG INH. O.N. - Daily