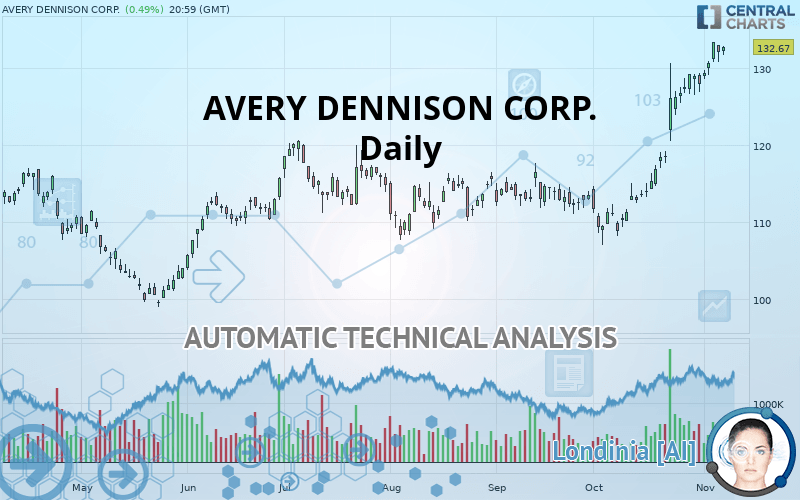
AVERY DENNISON CORP. - Daily - Technical analysis published on 11/07/2019 (GMT)
- Who voted?
- 234
- 0
Click here for a new analysis!
- Timeframe : Daily
- - Analysis generated on
- Status : LEVEL MAINTAINED
Summary of the analysis

Additional analysis
Quotes
The AVERY DENNISON CORP. rating is 132.67 USD. The price registered an increase of +0.49% on the session with the lowest point at 131.72 USD and the highest point at 132.86 USD. The deviation from the price is +0.72% for the low point and -0.14% for the high point.The Central Gaps scanner detects a bullish opening. A small advantage for buyers in the very short term.
Bullish opening
Type : Bullish
Timeframe : Openning
Here is a more detailed summary of the historical variations registered by AVERY DENNISON CORP.:
New HIGH record (5 years)
Type : Bullish
Timeframe : Weekly
Near a new HIGH record (1 year)
Type : Bullish
Timeframe : Weekly
Near a new HIGH record (1st january)
Type : Bullish
Timeframe : Weekly
Near a new HIGH record (1 month)
Type : Bullish
Timeframe : Weekly
Technical
Technical analysis of this Daily chart of AVERY DENNISON CORP. indicates that the overall trend is strongly bullish. 92.86% of the signals given by moving averages are bullish. The overall trend is supported by the strong bullish signals from short-term moving averages. The Central Indicators scanner does not detect any result on moving averages that would impact this trend.
In fact, 15 technical indicators on 18 studied are currently bullish. Caution: the Central Indicators scanner currently detects an excess:
RSI indicator is overbought : over 70
Type : Neutral
Timeframe : Daily
CCI indicator is overbought : over 100
Type : Neutral
Timeframe : Daily
CCI indicator: bearish divergence
Type : Bearish
Timeframe : Daily
MACD indicator: bearish divergence
Type : Bearish
Timeframe : Daily
RSI indicator: bearish divergence
Type : Bearish
Timeframe : Daily
Williams %R indicator is overbought : over -20
Type : Neutral
Timeframe : Daily
Pivot points : price is over resistance 2
Type : Neutral
Timeframe : Weekly
An analysis of the price chart with the Central Patterns scanner (detector of chart patterns and resistances and supports) shows a result that can have an impact on the price change:
Resistance of channel is broken
Type : Bullish
Timeframe : Daily
For a small setback in the very short term, the Central Candlesticks scanner currently notes the presence of this bearish pattern in Japanese candlesticks:
Bearish harami
Type : Bearish
Timeframe : Daily
| S3 | S2 | S1 | Price | |
|---|---|---|---|---|
| ProTrendLines | 116.46 | 120.48 | 122.68 | 132.67 |
| Change (%) | -12.22% | -9.19% | -7.53% | - |
| Change | -16.21 | -12.19 | -9.99 | - |
| Level | Major | Intermediate | Major | - |
To determine price objectives, it is also possible to use the pivot points. Here is the price position in relation to pivot points:
| Pivot points | S3 | S2 | S1 | PP | R1 | R2 | R3 |
|---|---|---|---|---|---|---|---|
| Standard | 128.71 | 129.77 | 130.89 | 131.95 | 133.07 | 134.13 | 135.25 |
| Camarilla | 131.42 | 131.62 | 131.82 | 132.02 | 132.22 | 132.42 | 132.62 |
| Woodie | 128.75 | 129.79 | 130.93 | 131.97 | 133.11 | 134.15 | 135.29 |
| Fibonacci | 129.77 | 130.60 | 131.11 | 131.95 | 132.78 | 133.29 | 134.13 |
| Pivot points | S3 | S2 | S1 | PP | R1 | R2 | R3 |
|---|---|---|---|---|---|---|---|
| Standard | 124.26 | 125.41 | 127.40 | 128.55 | 130.54 | 131.69 | 133.68 |
| Camarilla | 128.54 | 128.82 | 129.11 | 129.40 | 129.69 | 129.98 | 130.26 |
| Woodie | 124.69 | 125.62 | 127.83 | 128.76 | 130.97 | 131.90 | 134.11 |
| Fibonacci | 125.41 | 126.61 | 127.35 | 128.55 | 129.75 | 130.49 | 131.69 |
| Pivot points | S3 | S2 | S1 | PP | R1 | R2 | R3 |
|---|---|---|---|---|---|---|---|
| Standard | 89.56 | 98.32 | 113.09 | 121.85 | 136.62 | 145.38 | 160.15 |
| Camarilla | 121.39 | 123.55 | 125.70 | 127.86 | 130.02 | 132.17 | 134.33 |
| Woodie | 92.57 | 99.82 | 116.10 | 123.35 | 139.63 | 146.88 | 163.16 |
| Fibonacci | 98.32 | 107.31 | 112.86 | 121.85 | 130.84 | 136.39 | 145.38 |
Numerical data
The following is the status of technical indicators and moving averages registered at the time this technical analysis was created:
| RSI (14): | 77.62 | |
| MACD (12,26,9): | 4.9900 | |
| Directional Movement: | 34.12 | |
| AROON (14): | 85.71 | |
| DEMA (21): | 130.59 | |
| Parabolic SAR (0,02-0,02-0,2): | 125.96 | |
| Elder Ray (13): | 4.96 | |
| Super Trend (3,10): | 124.33 | |
| Zig ZAG (10): | 132.67 | |
| VORTEX (21): | 1.2900 | |
| Stochastique (14,3,5): | 96.35 | |
| TEMA (21): | 133.72 | |
| Williams %R (14): | -3.70 | |
| Chande Momentum Oscillator (20): | 14.17 | |
| Repulse (5,40,3): | 1.8900 | |
| ROCnROLL: | 1 | |
| TRIX (15,9): | 0.5000 | |
| Courbe Coppock: | 28.13 |
| MA7: | 130.49 | |
| MA20: | 122.73 | |
| MA50: | 116.80 | |
| MA100: | 115.08 | |
| MAexp7: | 130.31 | |
| MAexp20: | 124.55 | |
| MAexp50: | 118.95 | |
| MAexp100: | 115.31 | |
| Price / MA7: | +1.67% | |
| Price / MA20: | +8.10% | |
| Price / MA50: | +13.59% | |
| Price / MA100: | +15.29% | |
| Price / MAexp7: | +1.81% | |
| Price / MAexp20: | +6.52% | |
| Price / MAexp50: | +11.53% | |
| Price / MAexp100: | +15.06% |
News
Don"t forget to follow the news on AVERY DENNISON CORP.. At the time of publication of this analysis, the latest news was as follows:
- Avery Dennison Announces Upcoming Investor Events
- Robomart and Avery Dennison Collaborate to Enable Frictionless Checkout-Free Experience
- VeriSolutions Closes Its Series A Led by Avery Dennison, Atlanta Seed Company and Service Provider Capital
- Avery Dennison Secures Global Contract With F.C. Barcelona® to Supply Names and Numbers for Team Jerseys
- New Research Coverage Highlights Avery Dennison, Raymond James Financial, Genuine Parts, Kimco Realty, Bristow Group, and Aimmune Therapeutics — Consolidated Revenues, Company Growth, and Expectations for 2018
About author

Online


Add a comment
Comments
0 comments on the analysis AVERY DENNISON CORP. - Daily