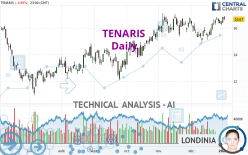
TENARIS - Daily - Technical analysis published on 01/03/2023 (GMT)
- 120
- 0
Click here for a new analysis!
- Timeframe : Daily
- - Analysis generated on
- Status : INVALID

Summary of the analysis

Additional analysis
Quotes
The TENARIS rating is 16.670 EUR. The price registered a decrease of -0.89% on the session with the lowest point at 16.625 EUR and the highest point at 16.890 EUR. The deviation from the price is +0.27% for the low point and -1.30% for the high point.The Central Gaps scanner detects a bullish gap which is a sign that buyers have taken the lead in the very short term.
Opening Gap UP
Type : Bullish
Timeframe : Openning
Here is a more detailed summary of the historical variations registered by TENARIS:
Near a new HIGH record (5 years)
Type : Bullish
Timeframe : Weekly
Near a new HIGH record (1 year)
Type : Bullish
Timeframe : Weekly
Near a new LOW record (1st january)
Type : Bearish
Timeframe : Weekly
New HIGH record (1 month)
Type : Bullish
Timeframe : Weekly
Technical
Technical analysis of this Daily chart of TENARIS indicates that the overall trend is strongly bullish. The signals given by the moving averages are 89.29% bullish. This strong bullish trend is confirmed by the strong signals currently being given by short-term moving averages. The Central Indicators market scanner is currently detecting a bullish signal that could impact this trend:
Bullish trend reversal : Moving Average 20
Type : Bullish
Timeframe : Daily
In fact, 14 technical indicators on 18 studied are currently bullish. But beware of excesses. The Central Indicators scanner currently detects this:
CCI indicator is overbought : over 100
Type : Neutral
Timeframe : Daily
CCI indicator: bearish divergence
Type : Bearish
Timeframe : Daily
Williams %R indicator is overbought : over -20
Type : Neutral
Timeframe : Daily
Pivot points : price is over resistance 1
Type : Neutral
Timeframe : Weekly
Central Patterns, the market scanner focusing on chart patterns, resistances and supports found these results:
Near resistance of channel
Type : Bearish
Timeframe : Daily
Horizontal resistance is broken
Type : Bullish
Timeframe : Daily
The Central Candlesticks scanner which studies Japanese candlesticks did not detect anything.
| S3 | S2 | S1 | Price | R1 | |
|---|---|---|---|---|---|
| ProTrendLines | 13.339 | 14.579 | 15.706 | 16.670 | 16.790 |
| Change (%) | -19.98% | -12.54% | -5.78% | - | +0.72% |
| Change | -3.331 | -2.091 | -0.964 | - | +0.120 |
| Level | Minor | Intermediate | Major | - | Major |
To determine price objectives, it is also possible to use the pivot points. Here is the price position in relation to pivot points:
| Pivot points | S3 | S2 | S1 | PP | R1 | R2 | R3 |
|---|---|---|---|---|---|---|---|
| Standard | 16.112 | 16.253 | 16.537 | 16.678 | 16.962 | 17.103 | 17.387 |
| Camarilla | 16.703 | 16.742 | 16.781 | 16.820 | 16.859 | 16.898 | 16.937 |
| Woodie | 16.183 | 16.289 | 16.608 | 16.714 | 17.033 | 17.139 | 17.458 |
| Fibonacci | 16.253 | 16.416 | 16.516 | 16.678 | 16.841 | 16.941 | 17.103 |
| Pivot points | S3 | S2 | S1 | PP | R1 | R2 | R3 |
|---|---|---|---|---|---|---|---|
| Standard | 15.500 | 15.875 | 16.080 | 16.455 | 16.660 | 17.035 | 17.240 |
| Camarilla | 16.126 | 16.179 | 16.232 | 16.285 | 16.338 | 16.391 | 16.445 |
| Woodie | 15.415 | 15.833 | 15.995 | 16.413 | 16.575 | 16.993 | 17.155 |
| Fibonacci | 15.875 | 16.097 | 16.233 | 16.455 | 16.677 | 16.813 | 17.035 |
| Pivot points | S3 | S2 | S1 | PP | R1 | R2 | R3 |
|---|---|---|---|---|---|---|---|
| Standard | 13.258 | 14.082 | 15.183 | 16.007 | 17.108 | 17.932 | 19.033 |
| Camarilla | 15.756 | 15.932 | 16.109 | 16.285 | 16.462 | 16.638 | 16.814 |
| Woodie | 13.398 | 14.151 | 15.323 | 16.076 | 17.248 | 18.001 | 19.173 |
| Fibonacci | 14.082 | 14.817 | 15.271 | 16.007 | 16.742 | 17.196 | 17.932 |
Numerical data
The following are the details of the technical indicators and moving averages that were collected to generate this technical analysis:
| RSI (14): | 58.97 | |
| MACD (12,26,9): | 0.2240 | |
| Directional Movement: | 8.284 | |
| AROON (14): | 78.571 | |
| DEMA (21): | 16.490 | |
| Parabolic SAR (0,02-0,02-0,2): | 15.742 | |
| Elder Ray (13): | 0.422 | |
| Super Trend (3,10): | 15.532 | |
| Zig ZAG (10): | 16.725 | |
| VORTEX (21): | 1.0330 | |
| Stochastique (14,3,5): | 87.44 | |
| TEMA (21): | 16.578 | |
| Williams %R (14): | -9.07 | |
| Chande Momentum Oscillator (20): | 1.250 | |
| Repulse (5,40,3): | 1.0190 | |
| ROCnROLL: | 1 | |
| TRIX (15,9): | 0.1020 | |
| Courbe Coppock: | 13.13 |
| MA7: | 16.588 | |
| MA20: | 15.995 | |
| MA50: | 16.067 | |
| MA100: | 14.987 | |
| MAexp7: | 16.528 | |
| MAexp20: | 16.233 | |
| MAexp50: | 15.836 | |
| MAexp100: | 15.183 | |
| Price / MA7: | +0.49% | |
| Price / MA20: | +4.22% | |
| Price / MA50: | +3.75% | |
| Price / MA100: | +11.23% | |
| Price / MAexp7: | +0.86% | |
| Price / MAexp20: | +2.69% | |
| Price / MAexp50: | +5.27% | |
| Price / MAexp100: | +9.79% |
News
The latest news and videos published on TENARIS at the time of the analysis were as follows:
- Glancy Prongay & Murray LLP Obtains Important Ruling for Tenaris S.A. Investors in Securities Fraud Class Action
- TENARIS 24 HOUR DEADLINE ALERT: Approximately 24 Hours Remain; ClaimsFiler Reminds Investors with Losses in Excess of $100,000 of Deadline in Class Action Lawsuit against Tenaris S.A. - TS
- TENARIS 72 HOUR DEADLINE ALERT: Approximately 72 Hours Remain; Former Louisiana Attorney General and Kahn Swick & Foti, LLC Remind Investors with Losses in Excess of $100,000 of Deadline in Class Action Lawsuit against Tenaris S.A. - TS
- Kessler Topaz Meltzer & Check, LLP: Securities Fraud Class Action Filed Against Tenaris S.A. - TS
- TS LOSS DEADLINE: Rosen Law Firm Files First Securities Class Action Lawsuit Against Tenaris S.A.; Reminds of Important Deadline - TS
About author
Online


Add a comment
Comments
0 comments on the analysis TENARIS - Daily