TENARIS - Daily - Technical analysis published on 06/29/2023 (GMT)
- 102
- 0
Click here for a new analysis!
- Timeframe : Daily
- - Analysis generated on
- Status : TARGET REACHED

Summary of the analysis

Additional analysis
Quotes
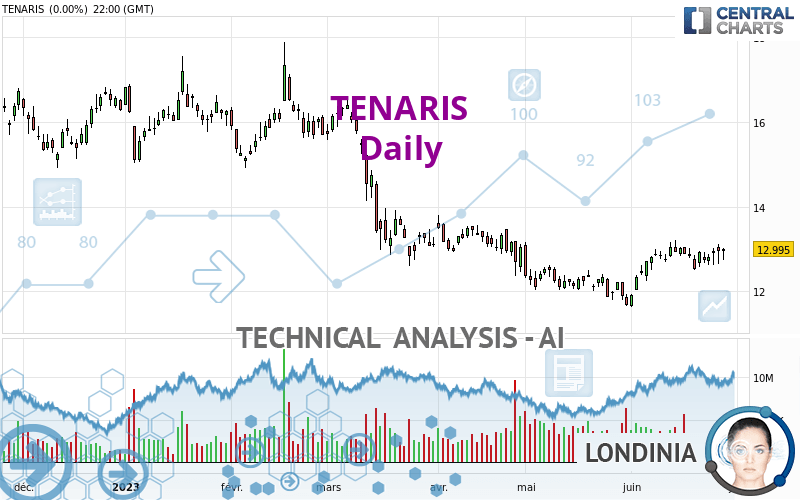
TENARIS rating 13.335 EUR. The price has increased by +2.62% since the last closing and was traded between 13.095 EUR and 13.390 EUR over the period. The price is currently at +1.83% from its lowest and -0.41% from its highest.A bullish gap was detected at the opening by the Central Gaps scanner. There are a lot of buyers and they have the upper hand in the very short term.
Opening Gap UP
Type : Bullish
Timeframe : Openning
Here is a more detailed summary of the historical variations registered by TENARIS:
New HIGH record (1 month)
Type : Bullish
Timeframe : Weekly
Technical
A technical analysis in Daily of this TENARIS chart shows a bullish trend. The signals returned by the moving averages are 67.86% bullish. This bullish trend is reinforced by the strong signals currently being given by short-term moving averages. The Central Indicators market scanner is currently detecting several bullish signals that could impact this trend:
Bullish trend reversal : Moving Average 50
Type : Bullish
Timeframe : Daily
Bullish price crossover with Moving Average 100
Type : Bullish
Timeframe : Daily
In fact, 14 technical indicators on 18 studied are currently positioned bullish. But beware of excesses. The Central Indicators scanner currently detects this:
CCI indicator is overbought : over 100
Type : Neutral
Timeframe : Daily
Williams %R indicator is overbought : over -20
Type : Neutral
Timeframe : Daily
Pivot points : price is over resistance 2
Type : Neutral
Timeframe : Daily
Pivot points : price is over resistance 2
Type : Neutral
Timeframe : Weekly
Parabolic SAR indicator bullish reversal
Type : Bullish
Timeframe : Daily
Aroon indicator bullish trend
Type : Bullish
Timeframe : Daily
The Central Patterns scanner, which studies chart patterns, resistances and supports, has identified this signal:
Resistance of channel is broken
Type : Bullish
Timeframe : Daily
For a small rebound in the very short term, the Central Candlesticks scanner currently notes the presence of this bullish pattern in Japanese candlesticks:
Upside gap
Type : Bullish
Timeframe : Daily
| S3 | S2 | S1 | Price | R1 | R2 | R3 | |
|---|---|---|---|---|---|---|---|
| ProTrendLines | 11.886 | 12.486 | 13.027 | 13.335 | 14.896 | 16.337 | 16.838 |
| Change (%) | -10.87% | -6.37% | -2.31% | - | +11.71% | +22.51% | +26.27% |
| Change | -1.449 | -0.849 | -0.308 | - | +1.561 | +3.002 | +3.503 |
| Level | Intermediate | Minor | Major | - | Major | Intermediate | Major |
Attention could also be paid to pivot points to set price objectives:
| Pivot points | S3 | S2 | S1 | PP | R1 | R2 | R3 |
|---|---|---|---|---|---|---|---|
| Standard | 12.558 | 12.652 | 12.823 | 12.917 | 13.088 | 13.182 | 13.353 |
| Camarilla | 12.922 | 12.946 | 12.971 | 12.995 | 13.019 | 13.044 | 13.068 |
| Woodie | 12.598 | 12.671 | 12.863 | 12.936 | 13.128 | 13.201 | 13.393 |
| Fibonacci | 12.652 | 12.753 | 12.815 | 12.917 | 13.018 | 13.080 | 13.182 |
| Pivot points | S3 | S2 | S1 | PP | R1 | R2 | R3 |
|---|---|---|---|---|---|---|---|
| Standard | 12.032 | 12.268 | 12.537 | 12.773 | 13.042 | 13.278 | 13.547 |
| Camarilla | 12.666 | 12.712 | 12.759 | 12.805 | 12.851 | 12.898 | 12.944 |
| Woodie | 12.048 | 12.276 | 12.553 | 12.781 | 13.058 | 13.286 | 13.563 |
| Fibonacci | 12.268 | 12.461 | 12.580 | 12.773 | 12.966 | 13.085 | 13.278 |
| Pivot points | S3 | S2 | S1 | PP | R1 | R2 | R3 |
|---|---|---|---|---|---|---|---|
| Standard | 10.151 | 10.905 | 11.288 | 12.042 | 12.425 | 13.179 | 13.562 |
| Camarilla | 11.357 | 11.462 | 11.566 | 11.670 | 11.774 | 11.879 | 11.983 |
| Woodie | 9.965 | 10.812 | 11.102 | 11.949 | 12.239 | 13.086 | 13.376 |
| Fibonacci | 10.905 | 11.340 | 11.608 | 12.042 | 12.477 | 12.745 | 13.179 |
Numerical data
The following are the details of the technical indicators and moving averages that were collected to generate this technical analysis:
| RSI (14): | 63.90 | |
| MACD (12,26,9): | 0.1800 | |
| Directional Movement: | 12.563 | |
| AROON (14): | 50.000 | |
| DEMA (21): | 13.013 | |
| Parabolic SAR (0,02-0,02-0,2): | 12.505 | |
| Elder Ray (13): | 0.349 | |
| Super Trend (3,10): | 12.278 | |
| Zig ZAG (10): | 13.330 | |
| VORTEX (21): | 1.1600 | |
| Stochastique (14,3,5): | 75.13 | |
| TEMA (21): | 13.179 | |
| Williams %R (14): | -5.65 | |
| Chande Momentum Oscillator (20): | 0.285 | |
| Repulse (5,40,3): | 3.9690 | |
| ROCnROLL: | 1 | |
| TRIX (15,9): | 0.1950 | |
| Courbe Coppock: | 4.54 |
| MA7: | 12.960 | |
| MA20: | 12.834 | |
| MA50: | 12.421 | |
| MA100: | 13.324 | |
| MAexp7: | 13.008 | |
| MAexp20: | 12.792 | |
| MAexp50: | 12.752 | |
| MAexp100: | 13.149 | |
| Price / MA7: | +2.89% | |
| Price / MA20: | +3.90% | |
| Price / MA50: | +7.36% | |
| Price / MA100: | +0.08% | |
| Price / MAexp7: | +2.51% | |
| Price / MAexp20: | +4.24% | |
| Price / MAexp50: | +4.57% | |
| Price / MAexp100: | +1.41% |
News
The last news published on TENARIS at the time of the generation of this analysis was as follows:
- Glancy Prongay & Murray LLP Obtains Important Ruling for Tenaris S.A. Investors in Securities Fraud Class Action
- TENARIS 24 HOUR DEADLINE ALERT: Approximately 24 Hours Remain; ClaimsFiler Reminds Investors with Losses in Excess of $100,000 of Deadline in Class Action Lawsuit against Tenaris S.A. - TS
- TENARIS 72 HOUR DEADLINE ALERT: Approximately 72 Hours Remain; Former Louisiana Attorney General and Kahn Swick & Foti, LLC Remind Investors with Losses in Excess of $100,000 of Deadline in Class Action Lawsuit against Tenaris S.A. - TS
- Kessler Topaz Meltzer & Check, LLP: Securities Fraud Class Action Filed Against Tenaris S.A. - TS
- TS LOSS DEADLINE: Rosen Law Firm Files First Securities Class Action Lawsuit Against Tenaris S.A.; Reminds of Important Deadline - TS
About author
Online


Add a comment
Comments
0 comments on the analysis TENARIS - Daily