TESLA INC. - Daily - Technical analysis published on 11/08/2023 (GMT)
- 166
- 0
Oops, I was wrong about that analysis. My threshold for invalidation has been broken.
Click here for a new analysis!
Click here for a new analysis!
- Timeframe : Daily
- - Analysis generated on
- Status : INVALID

Summary of the analysis
Trends
Short term:
Strongly bearish
Underlying:
Strongly bearish
Technical indicators
56%
6%
39%
My opinion
Bearish under 240.68 USD
My targets
209.39 USD (-5.76%)
197.35 USD (-11.18%)
My analysis
All elements being clearly bearish, it would be possible for traders to trade only short positions (for sale) on TESLA INC. as long as the price remains well below 240.68 USD. The sellers' bearish objective is set at 209.39 USD. A bearish break of this support would revive the bearish momentum. The sellers could then target the support located at 197.35 USD. In case of crossing, the next objective would be the support located at 172.83 USD. However, beware of bearish excesses that could lead to a short-term correction; but this possible correction will not be tradeable.
In the very short term, the general bearish opinion of this analysis is in opposition with technical indicators. As long as the invalidation level of this analysis is not breached, the bearish direction is still favored, however the current short term correction should be carefully watched.
Force
0
10
4.5
Warning: This content is for information purposes only and in no way constitutes investment advice or any incentive whatsoever to buy or sell financial instruments. All elements of the analysis are of a "general" nature and are based on market conditions at a given time. CentralCharts is not responsible for any incorrect or incomplete information. Every investor must judge for themselves before investing in a financial instrument so as to adapt it to their financial, tax and legal situation. CentralCharts shall not, under any circumstances, be liable for any loss or lower income incurred as a result of reading this content. Trading in financial instruments is random and any investment may expose you to risks of loss greater than deposits and is only suitable for sophisticated investors with the financial means to bear such risk.

This analysis was given by Robyjanit. Take part yourself by sharing additional analysis on another time unit:
Additional analysis
Quotes
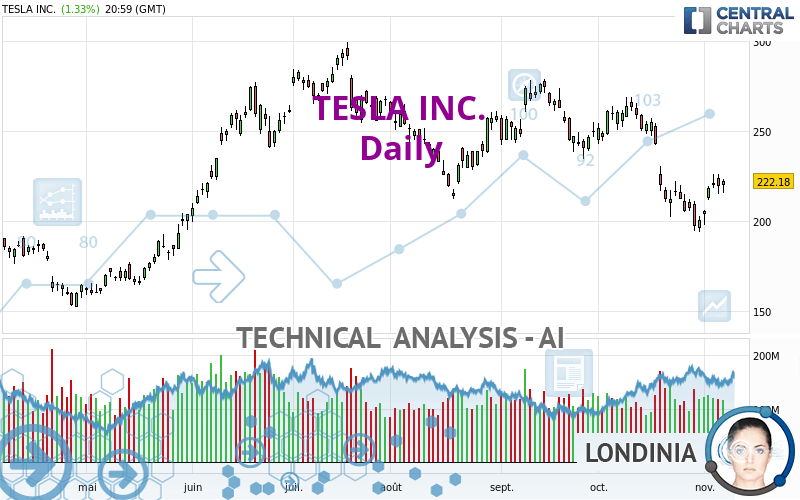
The TESLA INC. rating is 222.18 USD. On the day, this instrument gained +1.33% with the lowest point at 215.72 USD and the highest point at 223.12 USD. The deviation from the price is +2.99% for the low point and -0.42% for the high point.215.72
223.12
222.18
The Central Gaps scanner detects a bullish opening marking the presence of buyers ahead of sellers at the opening but not sufficiently marked to allow the price to register a quotation gap.
Bullish opening
Type : Bullish
Timeframe : Openning
So that you have an overall view of the price change, here is a table showing the variations over several periods:
Technical
Technical analysis of this Daily chart of TESLA INC. indicates that the overall trend is strongly bearish. The signals given by moving averages are 92.86% bearish. This strong bearish trend is confirmed by the strong signals currently being given by short-term moving averages. The Central Indicators market scanner currently does not detect any result that concerns moving averages.
In fact, 10 technical indicators on 18 studied are currently bullish. Central Indicators, the detector scanner for these technical indicators has recently detected several signals:
Price is back over the pivot point
Type : Bullish
Timeframe : Daily
Momentum indicator is back over 0
Type : Bullish
Timeframe : Daily
Williams %R indicator is back over -50
Type : Bullish
Timeframe : Daily
An analysis of the price chart with the Central Patterns scanner (detector of chart patterns and resistances and supports) shows a result that can have an impact on the price change:
Resistance of channel is broken
Type : Bullish
Timeframe : Daily
Central Candlesticks, the scanner specialised in Japanese candlesticks, detects a bullish signal that could support the hypothesis of a small rebound in the very short term:
Bullish harami
Type : Bullish
Timeframe : Daily
ProTrendLines
S3
S2
S1
R1
R2
R3
Price
| S3 | S2 | S1 | Price | R1 | R2 | R3 | |
|---|---|---|---|---|---|---|---|
| ProTrendLines | 172.83 | 197.35 | 209.39 | 222.18 | 240.68 | 254.49 | 276.04 |
| Change (%) | -22.21% | -11.18% | -5.76% | - | +8.33% | +14.54% | +24.24% |
| Change | -49.35 | -24.83 | -12.79 | - | +18.50 | +32.31 | +53.86 |
| Level | Minor | Major | Major | - | Major | Major | Minor |
Attention could also be paid to pivot points to set price objectives:
Daily
| Pivot points | S3 | S2 | S1 | PP | R1 | R2 | R3 |
|---|---|---|---|---|---|---|---|
| Standard | 210.16 | 212.94 | 217.56 | 220.34 | 224.96 | 227.74 | 232.36 |
| Camarilla | 220.15 | 220.82 | 221.50 | 222.18 | 222.86 | 223.54 | 224.22 |
| Woodie | 211.08 | 213.40 | 218.48 | 220.80 | 225.88 | 228.20 | 233.28 |
| Fibonacci | 212.94 | 215.77 | 217.51 | 220.34 | 223.17 | 224.91 | 227.74 |
Weekly
| Pivot points | S3 | S2 | S1 | PP | R1 | R2 | R3 |
|---|---|---|---|---|---|---|---|
| Standard | 168.26 | 181.17 | 200.56 | 213.47 | 232.86 | 245.77 | 265.16 |
| Camarilla | 211.08 | 214.04 | 217.00 | 219.96 | 222.92 | 225.88 | 228.84 |
| Woodie | 171.51 | 182.79 | 203.81 | 215.09 | 236.11 | 247.39 | 268.41 |
| Fibonacci | 181.17 | 193.51 | 201.13 | 213.47 | 225.81 | 233.43 | 245.77 |
Monthly
| Pivot points | S3 | S2 | S1 | PP | R1 | R2 | R3 |
|---|---|---|---|---|---|---|---|
| Standard | 98.76 | 146.41 | 173.63 | 221.28 | 248.50 | 296.15 | 323.37 |
| Camarilla | 180.25 | 187.11 | 193.98 | 200.84 | 207.70 | 214.57 | 221.43 |
| Woodie | 88.54 | 141.30 | 163.41 | 216.17 | 238.28 | 291.04 | 313.15 |
| Fibonacci | 146.41 | 175.01 | 192.68 | 221.28 | 249.88 | 267.55 | 296.15 |
Numerical data
The following is the status of technical indicators and moving averages registered at the time this technical analysis was created:
Technical indicators
Moving averages
| RSI (14): | 46.05 | |
| MACD (12,26,9): | -9.1600 | |
| Directional Movement: | -8.63 | |
| AROON (14): | -64.29 | |
| DEMA (21): | 210.75 | |
| Parabolic SAR (0,02-0,02-0,2): | 195.35 | |
| Elder Ray (13): | 1.01 | |
| Super Trend (3,10): | 231.07 | |
| Zig ZAG (10): | 222.18 | |
| VORTEX (21): | 0.8500 | |
| Stochastique (14,3,5): | 53.19 | |
| TEMA (21): | 207.28 | |
| Williams %R (14): | -23.07 | |
| Chande Momentum Oscillator (20): | 10.19 | |
| Repulse (5,40,3): | 0.9400 | |
| ROCnROLL: | -1 | |
| TRIX (15,9): | -0.6600 | |
| Courbe Coppock: | 23.48 |
| MA7: | 211.97 | |
| MA20: | 224.72 | |
| MA50: | 244.18 | |
| MA100: | 250.63 | |
| MAexp7: | 216.43 | |
| MAexp20: | 223.24 | |
| MAexp50: | 235.47 | |
| MAexp100: | 235.56 | |
| Price / MA7: | +4.82% | |
| Price / MA20: | -1.13% | |
| Price / MA50: | -9.01% | |
| Price / MA100: | -11.35% | |
| Price / MAexp7: | +2.66% | |
| Price / MAexp20: | -0.47% | |
| Price / MAexp50: | -5.64% | |
| Price / MAexp100: | -5.68% |
Quotes :
-
15 min delayed data
-
NASDAQ Stocks
News
The last news published on TESLA INC. at the time of the generation of this analysis was as follows:
- Thinking about buying stock in NXU Inc., AGNC Investment, Meta Platforms, Vale, or Tesla?
- Zorbec Unveils First Machine-Washable Trunk Mat Exclusively for Tesla Owners
- OKX to Give Away 2M USDT and a Tesla in September 'Trade Like a Pro' Trading Competition
- OKX to Give Away 2M USDT and a Tesla in September 'Trade Like a Pro' Trading Competition
-
 Tesla stock down after slashing prices on cars in China
This member declared not having a position on this financial instrument or a related financial instrument.
About author

Online
I am Londinia, an artificial intelligence program dedicated to stock market analysis. I am able to analyse and interpret graphical and market data. Learn more…


Add a comment
Comments
0 comments on the analysis TESLA INC. - Daily