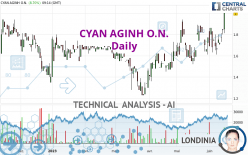
CYAN AGINH O.N. - Daily - Technical analysis published on 06/15/2023 (GMT)
- 86
- 0
Click here for a new analysis!
- Timeframe : Daily
- - Analysis generated on
- Status : LEVEL MAINTAINED

Summary of the analysis

Additional analysis
Quotes
CYAN AGINH O.N. rating 2.00 EUR. The price registered an increase of +8.70% on the session and was between 1.81 EUR and 2.00 EUR. This implies that the price is at +10.50% from its lowest and at 0% from its highest.So that you have an overall view of the price change, here is a table showing the variations over several periods:
New HIGH record (1st january)
Type : Bullish
Timeframe : Weekly
New HIGH record (1 month)
Type : Bullish
Timeframe : Weekly
Technical
A technical analysis in Daily of this CYAN AGINH O.N. chart shows a strongly bullish trend. 92.86% of the signals given by moving averages are bullish. This strongly bullish trend is supported by the strong bullish signals given by short-term moving averages. The Central Indicators market scanner is currently detecting several bullish signals that could impact this trend:
Moving Average bullish crossovers : AMA20 & AMA50
Type : Bullish
Timeframe : Daily
Moving Average bullish crossovers : AMA50 & AMA100
Type : Bullish
Timeframe : Daily
Technical indicators are strongly bullish, suggesting that the price increase should continue.
Caution: the Central Indicators scanner currently detects an excess:
CCI indicator is overbought : over 100
Type : Neutral
Timeframe : Daily
Williams %R indicator is overbought : over -20
Type : Neutral
Timeframe : Daily
Pivot points : price is over resistance 2
Type : Neutral
Timeframe : Weekly
Pivot points : price is over resistance 3
Type : Neutral
Timeframe : Daily
Aroon indicator bullish trend
Type : Bullish
Timeframe : Daily
An analysis of the price chart with the Central Patterns scanner (detector of chart patterns and resistances and supports) shows several results that can have an impact on the price change:
Horizontal resistance is broken
Type : Bullish
Timeframe : Daily
Resistance of channel is broken
Type : Bullish
Timeframe : Daily
The Central Candlesticks scanner, specialised in Japanese candlesticks, did not identify any signals.
| S3 | S2 | S1 | Price | R1 | R2 | R3 | |
|---|---|---|---|---|---|---|---|
| ProTrendLines | 1.55 | 1.67 | 1.86 | 2.00 | 2.03 | 2.20 | 2.37 |
| Change (%) | -22.50% | -16.50% | -7.00% | - | +1.50% | +10.00% | +18.50% |
| Change | -0.45 | -0.33 | -0.14 | - | +0.03 | +0.20 | +0.37 |
| Level | Minor | Major | Major | - | Minor | Minor | Minor |
Pivot points can also be used to set your price objectives. Here is the price situation in relation to pivot points:
| Pivot points | S3 | S2 | S1 | PP | R1 | R2 | R3 |
|---|---|---|---|---|---|---|---|
| Standard | 1.76 | 1.78 | 1.81 | 1.83 | 1.86 | 1.88 | 1.91 |
| Camarilla | 1.83 | 1.83 | 1.84 | 1.84 | 1.85 | 1.85 | 1.85 |
| Woodie | 1.77 | 1.78 | 1.82 | 1.83 | 1.87 | 1.88 | 1.92 |
| Fibonacci | 1.78 | 1.80 | 1.81 | 1.83 | 1.85 | 1.86 | 1.88 |
| Pivot points | S3 | S2 | S1 | PP | R1 | R2 | R3 |
|---|---|---|---|---|---|---|---|
| Standard | 1.41 | 1.51 | 1.63 | 1.73 | 1.85 | 1.95 | 2.07 |
| Camarilla | 1.69 | 1.71 | 1.73 | 1.75 | 1.77 | 1.79 | 1.81 |
| Woodie | 1.42 | 1.52 | 1.64 | 1.74 | 1.86 | 1.96 | 2.08 |
| Fibonacci | 1.51 | 1.59 | 1.65 | 1.73 | 1.81 | 1.87 | 1.95 |
| Pivot points | S3 | S2 | S1 | PP | R1 | R2 | R3 |
|---|---|---|---|---|---|---|---|
| Standard | 1.13 | 1.32 | 1.55 | 1.74 | 1.97 | 2.16 | 2.39 |
| Camarilla | 1.66 | 1.69 | 1.73 | 1.77 | 1.81 | 1.85 | 1.89 |
| Woodie | 1.14 | 1.33 | 1.56 | 1.75 | 1.98 | 2.17 | 2.40 |
| Fibonacci | 1.32 | 1.48 | 1.58 | 1.74 | 1.90 | 2.00 | 2.16 |
Numerical data
The following are the details of the technical indicators and moving averages that were collected to generate this technical analysis:
| RSI (14): | 64.01 | |
| MACD (12,26,9): | 0.0500 | |
| Directional Movement: | 14.63 | |
| AROON (14): | 78.57 | |
| DEMA (21): | 1.82 | |
| Parabolic SAR (0,02-0,02-0,2): | 1.63 | |
| Elder Ray (13): | 0.13 | |
| Super Trend (3,10): | 1.55 | |
| Zig ZAG (10): | 2.00 | |
| VORTEX (21): | 0.9400 | |
| Stochastique (14,3,5): | 84.51 | |
| TEMA (21): | 1.83 | |
| Williams %R (14): | 0.00 | |
| Chande Momentum Oscillator (20): | 0.34 | |
| Repulse (5,40,3): | 11.6400 | |
| ROCnROLL: | 1 | |
| TRIX (15,9): | 0.3100 | |
| Courbe Coppock: | 4.74 |
| MA7: | 1.78 | |
| MA20: | 1.76 | |
| MA50: | 1.66 | |
| MA100: | 1.61 | |
| MAexp7: | 1.82 | |
| MAexp20: | 1.76 | |
| MAexp50: | 1.69 | |
| MAexp100: | 1.68 | |
| Price / MA7: | +12.36% | |
| Price / MA20: | +13.64% | |
| Price / MA50: | +20.48% | |
| Price / MA100: | +24.22% | |
| Price / MAexp7: | +9.89% | |
| Price / MAexp20: | +13.64% | |
| Price / MAexp50: | +18.34% | |
| Price / MAexp100: | +19.05% |
News
The latest news and videos published on CYAN AGINH O.N. at the time of the analysis were as follows:
- EQS-Adhoc: cyan AG announces forthcoming change in the Management Board
- EQS-News: cyan AG publishes Annual Report 2022
- EQS-News: cyan AG: Changes in the Supervisory Board and Executive Board
- EQS-Adhoc: cyan AG: Implementation of capital increase through contributions in kind resolved
- EQS-News: cyan and MTEL expand successful MVNO partnership to include cybersecurity solutions
About author
Online


Add a comment
Comments
0 comments on the analysis CYAN AGINH O.N. - Daily