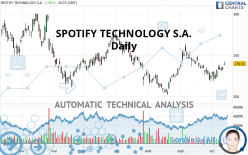
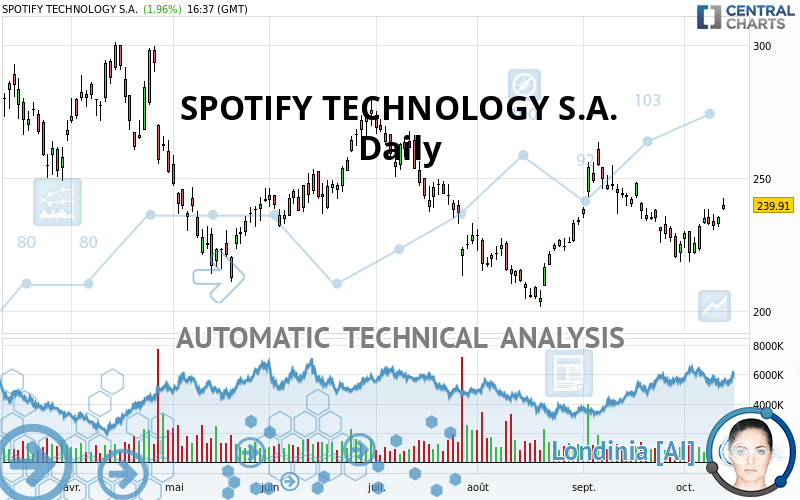
SPOTIFY TECHNOLOGY S.A. - Daily - Technical analysis published on 10/13/2021 (GMT)
- 370
- 0
Click here for a new analysis!
- Timeframe : Daily
- - Analysis generated on
- Status : TARGET REACHED
Summary of the analysis

Additional analysis
Quotes
The SPOTIFY TECHNOLOGY S.A. price is 239.90 USD. On the day, this instrument gained +1.96% with the lowest point at 238.11 USD and the highest point at 242.62 USD. The deviation from the price is +0.75% for the low point and -1.12% for the high point.The Central Gaps scanner detects the formation of a bullish gap marking the strong presence of buyers against sellers at the opening. This formed a quotation gap.
Opening Gap UP
Type : Bullish
Timeframe : Openning
A study of price movements over other periods shows the following variations:
Technical
A technical analysis in Daily of this SPOTIFY TECHNOLOGY S.A. chart shows a slightly bullish trend. 57.14% of the signals given by moving averages are bullish. The overall trend remains fragile, as do the slightly bullish signals given by short-term moving averages. An assessment of moving averages reveals several bullish signals that could impact this trend:
Bullish trend reversal : adaptative moving average 50
Type : Bullish
Timeframe : Daily
Bullish price crossover with Moving Average 20
Type : Bullish
Timeframe : Daily
Bullish price crossover with adaptative moving average 20
Type : Bullish
Timeframe : Daily
In fact, 13 technical indicators on 18 studied are currently positioned bullish. But beware of excesses. The Central Indicators scanner currently detects this:
Williams %R indicator is overbought : over -20
Type : Neutral
Timeframe : Daily
Pivot points : price is over resistance 2
Type : Neutral
Timeframe : Daily
RSI indicator is back over 50
Type : Bullish
Timeframe : Daily
Aroon indicator bullish trend
Type : Bullish
Timeframe : Daily
Momentum indicator is back over 0
Type : Bullish
Timeframe : Daily
The Central Patterns scanner, which studies chart patterns, resistances and supports, has identified these signals:
Near resistance of triangle
Type : Bearish
Timeframe : Daily
Horizontal resistance is broken
Type : Bullish
Timeframe : Daily
The Central Candlesticks scanner which studies Japanese candlesticks did not detect anything.
| S3 | S2 | S1 | Price | R1 | R2 | R3 | |
|---|---|---|---|---|---|---|---|
| ProTrendLines | 205.08 | 217.11 | 231.33 | 239.90 | 254.29 | 275.74 | 291.64 |
| Change (%) | -14.51% | -9.50% | -3.57% | - | +6.00% | +14.94% | +21.57% |
| Change | -34.82 | -22.79 | -8.57 | - | +14.39 | +35.84 | +51.74 |
| Level | Major | Major | Major | - | Major | Minor | Intermediate |
Attention could also be paid to pivot points to set price objectives:
| Pivot points | S3 | S2 | S1 | PP | R1 | R2 | R3 |
|---|---|---|---|---|---|---|---|
| Standard | 228.37 | 229.93 | 232.62 | 234.18 | 236.87 | 238.43 | 241.12 |
| Camarilla | 234.13 | 234.52 | 234.91 | 235.30 | 235.69 | 236.08 | 236.47 |
| Woodie | 228.93 | 230.21 | 233.18 | 234.46 | 237.43 | 238.71 | 241.68 |
| Fibonacci | 229.93 | 231.56 | 232.56 | 234.18 | 235.81 | 236.81 | 238.43 |
| Pivot points | S3 | S2 | S1 | PP | R1 | R2 | R3 |
|---|---|---|---|---|---|---|---|
| Standard | 201.81 | 210.23 | 221.56 | 229.98 | 241.31 | 249.73 | 261.06 |
| Camarilla | 227.45 | 229.26 | 231.07 | 232.88 | 234.69 | 236.50 | 238.31 |
| Woodie | 203.26 | 210.96 | 223.01 | 230.71 | 242.76 | 250.46 | 262.51 |
| Fibonacci | 210.23 | 217.78 | 222.44 | 229.98 | 237.53 | 242.19 | 249.73 |
| Pivot points | S3 | S2 | S1 | PP | R1 | R2 | R3 |
|---|---|---|---|---|---|---|---|
| Standard | 162.96 | 190.73 | 208.04 | 235.81 | 253.12 | 280.89 | 298.20 |
| Camarilla | 212.94 | 217.08 | 221.21 | 225.34 | 229.47 | 233.61 | 237.74 |
| Woodie | 157.72 | 188.12 | 202.80 | 233.20 | 247.88 | 278.28 | 292.96 |
| Fibonacci | 190.73 | 207.95 | 218.59 | 235.81 | 253.03 | 263.67 | 280.89 |
Numerical data
The following is the status of the technical indicators and moving averages at the time of publication of this technical analysis:
| RSI (14): | 56.78 | |
| MACD (12,26,9): | -0.1600 | |
| Directional Movement: | 6.16 | |
| AROON (14): | 64.29 | |
| DEMA (21): | 232.62 | |
| Parabolic SAR (0,02-0,02-0,2): | 221.75 | |
| Elder Ray (13): | 7.46 | |
| Super Trend (3,10): | 244.57 | |
| Zig ZAG (10): | 239.55 | |
| VORTEX (21): | 0.9100 | |
| Stochastique (14,3,5): | 80.15 | |
| TEMA (21): | 232.58 | |
| Williams %R (14): | -12.09 | |
| Chande Momentum Oscillator (20): | 6.85 | |
| Repulse (5,40,3): | 0.5400 | |
| ROCnROLL: | 1 | |
| TRIX (15,9): | -0.0600 | |
| Courbe Coppock: | 2.65 |
| MA7: | 233.21 | |
| MA20: | 232.66 | |
| MA50: | 229.97 | |
| MA100: | 238.64 | |
| MAexp7: | 233.93 | |
| MAexp20: | 233.09 | |
| MAexp50: | 234.42 | |
| MAexp100: | 240.80 | |
| Price / MA7: | +2.87% | |
| Price / MA20: | +3.11% | |
| Price / MA50: | +4.32% | |
| Price / MA100: | +0.53% | |
| Price / MAexp7: | +2.55% | |
| Price / MAexp20: | +2.92% | |
| Price / MAexp50: | +2.34% | |
| Price / MAexp100: | -0.37% |
About author

Online


Add a comment
Comments
0 comments on the analysis SPOTIFY TECHNOLOGY S.A. - Daily