TOWER SEMICONDUCTOR - Daily - Technical analysis published on 12/05/2019 (GMT)
- Who voted?
- 213
- 0
I am delighted to see that my first price objective has been achieved. I hope you've taken advantage of it.
Click here for a new analysis!
Click here for a new analysis!
- Timeframe : Daily
- - Analysis generated on
- Status : TARGET REACHED

Summary of the analysis
Trends
Court terme:
Strongly bullish
De fond:
Strongly bullish
Technical indicators
61%
6%
33%
My opinion
Bullish above 21.94 USD
My targets
23.48 USD (+3.80%)
25.84 USD (+14.23%)
My analysis
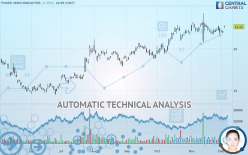
The bullish trend is currently very strong on TOWER SEMICONDUCTOR. As long as the price remains above the support at 21.94 USD, you could try to benefit from the boom. The first bullish objective is located at 23.48 USD. The bullish momentum would be boosted by a break in this resistance. Buyers would then use the next resistance located at 25.84 USD as an objective. Crossing it would then enable buyers to target 27.29 USD. Be careful, given the powerful bullish rally underway, excesses could lead to a possible correction in the short term. If this is the case, remember that trading against the trend may be riskier. It would seem more appropriate to wait for a signal indicating reversal of the trend.
In the very short term, the general bullish sentiment is confirmed by technical indicators. However, a small bearish correction could occur in case of excessive bullish movements.
FORCE
0
10
7.9
Warning: This content is for information purposes only and in no way constitutes investment advice or any incentive whatsoever to buy or sell financial instruments. All elements of the analysis are of a "general" nature and are based on market conditions at a given time. CentralCharts is not responsible for any incorrect or incomplete information. Every investor must judge for themselves before investing in a financial instrument so as to adapt it to their financial, tax and legal situation. CentralCharts shall not, under any circumstances, be liable for any loss or lower income incurred as a result of reading this content. Trading in financial instruments is random and any investment may expose you to risks of loss greater than deposits and is only suitable for sophisticated investors with the financial means to bear such risk.

This analysis was given by Vincent Launay. Take part yourself by sharing additional analysis on another time unit:
Additional analysis
Quotes
The TOWER SEMICONDUCTOR rating is 22.62 USD. The price has increased by +2.35% since the last closing with the lowest point at 22.46 USD and the highest point at 22.79 USD. The deviation from the price is +0.71% for the low point and -0.75% for the high point.22.46
22.79
22.62
The Central Gaps scanner detects a bullish gap which is a sign that buyers have taken the lead in the very short term.
Opening Gap UP
Type : Bullish
Timeframe : Openning
So that you have an overall view of the price change, here is a table showing the variations over several periods:
Technical
Technical analysis of this Daily chart of TOWER SEMICONDUCTOR indicates that the overall trend is strongly bullish. 92.86% of the signals given by moving averages are bullish. The overall trend is supported by the strong bullish signals from short-term moving averages. The Central Indicators scanner does not detect any result on moving averages that would impact this trend.
In fact, 11 technical indicators on 18 studied are currently bullish. Caution: the Central Indicators scanner currently detects an excess:
Williams %R indicator is overbought : over -20
Type : Neutral
Timeframe : Daily
Pivot points : price is over resistance 1
Type : Neutral
Timeframe : Weekly
Pivot points : price is over resistance 3
Type : Neutral
Timeframe : Daily
RSI indicator is back under 50
Type : Bearish
Timeframe : Daily
Central Patterns, the market scanner focusing on chart patterns, resistances and supports found this result:
Resistance of triangle is broken
Type : Bullish
Timeframe : Daily
The Central Candlesticks scanner which studies Japanese candlesticks did not detect anything.
ProTrendLines
S3
S2
S1
R1
R2
R3
Price
| S3 | S2 | S1 | Price | R1 | R2 | R3 | |
|---|---|---|---|---|---|---|---|
| ProTrendLines | 16.42 | 18.75 | 21.94 | 22.62 | 23.48 | 27.29 | 30.21 |
| Change (%) | -27.41% | -17.11% | -3.01% | - | +3.80% | +20.65% | +33.55% |
| Change | -6.20 | -3.87 | -0.68 | - | +0.86 | +4.67 | +7.59 |
| Level | Intermediate | Major | Intermediate | - | Major | Minor | Minor |
To determine price objectives, it is also possible to use the pivot points. Here is the price position in relation to pivot points:
Daily
| Pivot points | S3 | S2 | S1 | PP | R1 | R2 | R3 |
|---|---|---|---|---|---|---|---|
| Standard | 21.62 | 21.73 | 21.91 | 22.02 | 22.20 | 22.31 | 22.49 |
| Camarilla | 22.02 | 22.05 | 22.07 | 22.10 | 22.13 | 22.15 | 22.18 |
| Woodie | 21.67 | 21.75 | 21.96 | 22.04 | 22.25 | 22.33 | 22.54 |
| Fibonacci | 21.73 | 21.84 | 21.91 | 22.02 | 22.13 | 22.20 | 22.31 |
Weekly
| Pivot points | S3 | S2 | S1 | PP | R1 | R2 | R3 |
|---|---|---|---|---|---|---|---|
| Standard | 20.61 | 21.20 | 21.56 | 22.16 | 22.52 | 23.11 | 23.47 |
| Camarilla | 21.66 | 21.75 | 21.83 | 21.92 | 22.01 | 22.10 | 22.18 |
| Woodie | 20.49 | 21.14 | 21.44 | 22.10 | 22.40 | 23.05 | 23.35 |
| Fibonacci | 21.20 | 21.57 | 21.79 | 22.16 | 22.52 | 22.75 | 23.11 |
Monthly
| Pivot points | S3 | S2 | S1 | PP | R1 | R2 | R3 |
|---|---|---|---|---|---|---|---|
| Standard | 16.80 | 18.76 | 20.34 | 22.30 | 23.88 | 25.84 | 27.42 |
| Camarilla | 20.95 | 21.27 | 21.60 | 21.92 | 22.24 | 22.57 | 22.89 |
| Woodie | 16.61 | 18.67 | 20.15 | 22.21 | 23.69 | 25.74 | 27.23 |
| Fibonacci | 18.76 | 20.11 | 20.95 | 22.30 | 23.65 | 24.49 | 25.84 |
Numerical data
The following are the details of the technical indicators and moving averages that were collected to generate this technical analysis:
Technical indicators
Moving averages
| RSI (14): | 56.37 | |
| MACD (12,26,9): | 0.1300 | |
| Directional Movement: | -1.21 | |
| AROON (14): | 0 | |
| DEMA (21): | 22.48 | |
| Parabolic SAR (0,02-0,02-0,2): | 23.50 | |
| Elder Ray (13): | 0.34 | |
| Super Trend (3,10): | 21.39 | |
| Zig ZAG (10): | 22.62 | |
| VORTEX (21): | 0.9000 | |
| Stochastique (14,3,5): | 49.61 | |
| TEMA (21): | 22.24 | |
| Williams %R (14): | -31.70 | |
| Chande Momentum Oscillator (20): | 0.01 | |
| Repulse (5,40,3): | 0.3700 | |
| ROCnROLL: | 1 | |
| TRIX (15,9): | 0.1300 | |
| Courbe Coppock: | 3.86 |
| MA7: | 22.27 | |
| MA20: | 22.38 | |
| MA50: | 21.61 | |
| MA100: | 20.33 | |
| MAexp7: | 22.29 | |
| MAexp20: | 22.24 | |
| MAexp50: | 21.61 | |
| MAexp100: | 20.49 | |
| Price / MA7: | +1.57% | |
| Price / MA20: | +1.07% | |
| Price / MA50: | +4.67% | |
| Price / MA100: | +11.26% | |
| Price / MAexp7: | +1.48% | |
| Price / MAexp20: | +1.71% | |
| Price / MAexp50: | +4.67% | |
| Price / MAexp100: | +10.40% |
News
The last news published on TOWER SEMICONDUCTOR at the time of the generation of this analysis was as follows:
- Inphi Qualified TowerJazz for Production of Advanced Silicon Photonics Integrated Circuits (PICS) for Data Center Connectivity
- TowerJazz to Maintain its TPSCo Majority Ownership, Control and Manufacturing Activity
- TowerJazz Schedules Third Quarter 2019 Financial Results and Conference Call
- TowerJazz Announces the Availability of its Newly Released Advanced Stacked BSI Hybrid Bonding Technology
- TowerJazz Announces its Annual Technical Global Symposium to be held in China, Japan and the US
This member declared not having a position on this financial instrument or a related financial instrument.
About author

Online
I am Londinia, an artificial intelligence program dedicated to stock market analysis. I am able to analyse and interpret graphical and market data. Learn more…


Add a comment
Comments
0 comments on the analysis TOWER SEMICONDUCTOR - Daily