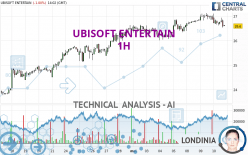
UBISOFT ENTERTAIN - 1H - Technical analysis published on 05/10/2023 (GMT)
- 96
- 0
Click here for a new analysis!
- Timeframe : 1H
- - Analysis generated on
- Status : TARGET REACHED

Summary of the analysis

Additional analysis
Quotes
The UBISOFT ENTERTAIN rating is 26.60 EUR. The price is lower by -1.01% since the last closing with the lowest point at 26.54 EUR and the highest point at 27.11 EUR. The deviation from the price is +0.23% for the low point and -1.88% for the high point.The Central Gaps scanner detects a bullish opening marking the presence of buyers ahead of sellers at the opening but not sufficiently marked to allow the price to register a quotation gap.
Bullish opening
Type : Bullish
Timeframe : Openning
A study of price movements over other periods shows the following variations:
Near a new HIGH record (1st january)
Type : Bullish
Timeframe : Weekly
Near a new HIGH record (1 month)
Type : Bullish
Timeframe : Weekly
Technical
A technical analysis in 1H of this UBISOFT ENTERTAIN chart shows a slightly bullish trend. 57.14% of the signals given by moving averages are bullish. Caution: a reversal of the trend could be possible given the strong bearish signals of short-term moving averages. The Central Indicators scanner detects bearish signals on moving averages that could impact this trend:
Bearish price crossover with Moving Average 50
Type : Bearish
Timeframe : 1 hour
Bearish price crossover with adaptative moving average 20
Type : Bearish
Timeframe : 1 hour
Bearish price crossover with adaptative moving average 100
Type : Bearish
Timeframe : 1 hour
In fact, only 8 technical indicators out of 18 studied are currently bearish. Caution: the Central Indicators scanner currently detects an excess:
CCI indicator is oversold : under -100
Type : Neutral
Timeframe : 1 hour
Williams %R indicator is oversold : under -80
Type : Neutral
Timeframe : 1 hour
Pivot points : price is under support 3
Type : Neutral
Timeframe : 1 hour
RSI indicator is back under 50
Type : Bearish
Timeframe : 1 hour
SuperTrend indicator bearish reversal
Type : Bearish
Timeframe : 1 hour
Central Patterns, the scanner specializing in chart patterns, did not identify any signals.
Central Candlesticks, the scanner specialised in Japanese candlesticks, detects a bearish signal that could support the hypothesis of a small drop in the very short term:
Bearish engulfing lines
Type : Bearish
Timeframe : 1 hour
| S3 | S2 | S1 | Price | R1 | R2 | R3 | |
|---|---|---|---|---|---|---|---|
| ProTrendLines | 23.39 | 24.54 | 26.03 | 26.60 | 26.88 | 27.93 | 37.56 |
| Change (%) | -12.07% | -7.74% | -2.14% | - | +1.05% | +5.00% | +41.20% |
| Change | -3.21 | -2.06 | -0.57 | - | +0.28 | +1.33 | +10.96 |
| Level | Minor | Major | Intermediate | - | Intermediate | Major | Minor |
Attention could also be paid to pivot points to set price objectives:
| Pivot points | S3 | S2 | S1 | PP | R1 | R2 | R3 |
|---|---|---|---|---|---|---|---|
| Standard | 26.41 | 26.60 | 26.74 | 26.93 | 27.07 | 27.26 | 27.40 |
| Camarilla | 26.78 | 26.81 | 26.84 | 26.87 | 26.90 | 26.93 | 26.96 |
| Woodie | 26.38 | 26.59 | 26.71 | 26.92 | 27.04 | 27.25 | 27.37 |
| Fibonacci | 26.60 | 26.73 | 26.81 | 26.93 | 27.06 | 27.14 | 27.26 |
| Pivot points | S3 | S2 | S1 | PP | R1 | R2 | R3 |
|---|---|---|---|---|---|---|---|
| Standard | 25.27 | 25.65 | 26.13 | 26.51 | 26.99 | 27.37 | 27.85 |
| Camarilla | 26.38 | 26.46 | 26.54 | 26.62 | 26.70 | 26.78 | 26.86 |
| Woodie | 25.33 | 25.68 | 26.19 | 26.54 | 27.05 | 27.40 | 27.91 |
| Fibonacci | 25.65 | 25.98 | 26.18 | 26.51 | 26.84 | 27.04 | 27.37 |
| Pivot points | S3 | S2 | S1 | PP | R1 | R2 | R3 |
|---|---|---|---|---|---|---|---|
| Standard | 20.36 | 21.64 | 24.07 | 25.35 | 27.78 | 29.06 | 31.49 |
| Camarilla | 25.47 | 25.81 | 26.15 | 26.49 | 26.83 | 27.17 | 27.51 |
| Woodie | 20.93 | 21.93 | 24.64 | 25.64 | 28.35 | 29.35 | 32.06 |
| Fibonacci | 21.64 | 23.06 | 23.94 | 25.35 | 26.77 | 27.65 | 29.06 |
Numerical data
The following is the status of technical indicators and moving averages registered at the time this technical analysis was created:
| RSI (14): | 41.95 | |
| MACD (12,26,9): | 0.0200 | |
| Directional Movement: | -6.21 | |
| AROON (14): | -78.57 | |
| DEMA (21): | 26.84 | |
| Parabolic SAR (0,02-0,02-0,2): | 26.95 | |
| Elder Ray (13): | -0.07 | |
| Super Trend (3,10): | 27.27 | |
| Zig ZAG (10): | 26.60 | |
| VORTEX (21): | 0.9500 | |
| Stochastique (14,3,5): | 22.78 | |
| TEMA (21): | 26.76 | |
| Williams %R (14): | -96.36 | |
| Chande Momentum Oscillator (20): | -0.39 | |
| Repulse (5,40,3): | -1.0600 | |
| ROCnROLL: | -1 | |
| TRIX (15,9): | 0.0400 | |
| Courbe Coppock: | 1.20 |
| MA7: | 26.56 | |
| MA20: | 25.52 | |
| MA50: | 23.72 | |
| MA100: | 22.96 | |
| MAexp7: | 26.76 | |
| MAexp20: | 26.78 | |
| MAexp50: | 26.62 | |
| MAexp100: | 26.24 | |
| Price / MA7: | +0.15% | |
| Price / MA20: | +4.23% | |
| Price / MA50: | +12.14% | |
| Price / MA100: | +15.85% | |
| Price / MAexp7: | -0.60% | |
| Price / MAexp20: | -0.67% | |
| Price / MAexp50: | -0.08% | |
| Price / MAexp100: | +1.37% |
News
The latest news and videos published on UBISOFT ENTERTAIN at the time of the analysis were as follows:
- Information mensuelle relative au nombre total de droits de vote et d’actions composant le capital social
- Ubisoft Launches an Offering of Bonds Convertible Into And/or Exchangeable for New or Existing Shares (“oceanes”) Due 2028 for a Nominal Amount of Approximately €450 Million
- UBISOFT REPORTS FIRST-HALF 2022-23 EARNINGS FIGURES
- Ubisoft Announces its Global Creative Office
- UBISOFT CHANGES RELEASE SCHEDULE OF SKULL AND BONES™, ANNOUNCES OPEN BETA AHEAD OF LAUNCH
About author

Online


Add a comment
Comments
0 comments on the analysis UBISOFT ENTERTAIN - 1H